Ulta 2012 Annual Report Download - page 39
Download and view the complete annual report
Please find page 39 of the 2012 Ulta annual report below. You can navigate through the pages in the report by either clicking on the pages listed below, or by using the keyword search tool below to find specific information within the annual report.-
 1
1 -
2
-
3
-
4
-
5
-
6
-
7
-
8
-
9
-
10
-
11
-
12
-
13
-
14
-
15
-
16
-
17
-
18
-
19
-
20
-
21
-
22
-
23
-
24
-
25
-
26
-
27
-
28
-
 29
29 -
 30
30 -
 31
31 -
 32
32 -
 33
33 -
 34
34 -
 35
35 -
 36
36 -
 37
37 -
 38
38 -
 39
39 -
 40
40 -
 41
41 -
 42
42 -
 43
43 -
 44
44 -
 45
45 -
 46
46 -
 47
47 -
 48
48 -
 49
49 -
50
-
51
-
52
-
53
-
54
-
55
-
56
-
57
-
58
-
59
-
60
-
61
-
62
-
63
-
64
-
65
-
66
-
67
-
68
-
69
-
70
-
71
-
72
 |
 |
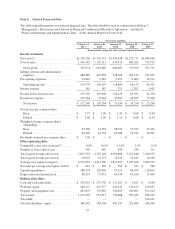
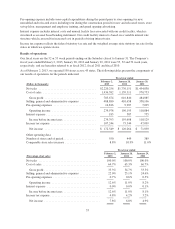
Fiscal year 2011 versus fiscal year 2010
Net sales
Net sales increased $321.4 million, or 22.1%, to $1,776.2 million in fiscal 2011 compared to $1,454.8 million in
fiscal 2010. Salon service sales increased $12.1 million, or 14.0% to $98.5 million compared to $86.4 million in
fiscal 2010. The sales increases were due to the opening of 60 net new stores in 2011 and a 10.9% increase in
comparable store sales which was primarily due to a 10.1% increase in store traffic. Non-comparable stores,
which include stores opened in fiscal 2011 as well as stores opened in fiscal 2010 which have not yet turned
comparable, contributed $168.4 million of the net sales increase while comparable stores contributed
$153.0 million of the total net sales increase. We attribute the increase in comparable store sales to our successful
marketing and merchandise strategies.
Gross profit
Gross profit increased $132.7 million, or 27.4%, to $616.8 million in fiscal 2011, compared to $484.1 million, in
fiscal 2010. Gross profit as a percentage of net sales increased 140 basis points to 34.7% in fiscal 2011 compared
to 33.3% in fiscal 2010. The increase in gross profit margin in fiscal 2011 was primarily driven by:
‰80 basis points of leverage in fixed store costs attributed to the impact of significantly higher sales levels in
fiscal 2011; and
‰70 basis points improvement in merchandise margin due primarily to improved promotional pricing and a
shift in category mix towards higher margin product compared with fiscal 2010.
Selling, general and administrative expenses
Selling, general and administrative (SG&A) expenses increased $52.6 million, or 14.7%, to $410.7 million in
fiscal 2011 compared to $358.1 million in fiscal 2010. As a percentage of net sales, SG&A expenses decreased
150 basis points to 23.1% in fiscal 2011 compared to 24.6% in fiscal 2010. The leverage in SG&A expense was
primarily driven by:
‰70 basis points improvement in variable store and marketing expense leverage attributed to cost efficiencies
and higher sales volume; and
‰60 basis points in corporate overhead leverage, excluding the fiscal 2010 non-recurring compensation
charge, attributed to higher sales volume.
Pre-opening expenses
Pre-opening expenses increased $2.9 million, or 40.8%, to $10.0 million in fiscal 2011 compared to $7.1 million
in fiscal 2010. During fiscal 2011, we opened 61 new stores, remodeled 17 stores and relocated 2 stores. During
fiscal 2010, we opened 47 new stores and remodeled 13 stores and relocated 5 stores.
Interest expense
Interest expense was $0.6 million in fiscal 2011 and $0.8 million in fiscal 2010. Interest expense for both periods
represents various fees related to the credit facility. We did not utilize our credit facility during fiscal 2011 or 2010.
Income tax expense
Income tax expense of $75.3 million in fiscal 2011 represents an effective tax rate of 38.5%, compared to fiscal
2010 tax expense of $47.1 million and an effective tax rate of 39.9%. The lower tax rate in fiscal 2011 is
primarily due to a decrease in non-deductible compensation expense and increases in certain federal and state tax
deductions and credits compared to fiscal 2010.
Net income
Net income increased $49.3 million, or 69.3%, to $120.3 million in fiscal 2011 compared to $71.0 million in
fiscal 2010. The increase in net income was primarily due to an increase in gross profit of $132.7 million, which
was offset by a $52.6 million increase in SG&A expenses and a $28.2 million increase in income tax expense.
35