US Bank 2015 Annual Report Download - page 4
Download and view the complete annual report
Please find page 4 of the 2015 US Bank annual report below. You can navigate through the pages in the report by either clicking on the pages listed below, or by using the keyword search tool below to find specific information within the annual report.-
 1
1 -
 2
2 -
 3
3 -
 4
4 -
 5
5 -
 6
6 -
 7
7 -
 8
8 -
 9
9 -
 10
10 -
 11
11 -
 12
12 -
 13
13 -
 14
14 -
 15
15 -
16
-
17
-
18
-
19
-
20
-
21
-
22
-
23
-
24
-
25
-
26
-
27
-
28
-
29
-
30
-
31
-
32
-
33
-
34
-
35
-
36
-
37
-
38
-
39
-
40
-
41
-
42
-
43
-
44
-
45
-
46
-
47
-
48
-
49
-
50
-
51
-
52
-
53
-
54
-
55
-
56
-
57
-
58
-
59
-
60
-
61
-
62
-
63
-
64
-
65
-
66
-
67
-
68
-
69
-
70
-
71
-
72
-
73
-
74
-
75
-
76
-
77
-
78
-
79
-
80
-
81
-
82
-
83
-
84
-
85
-
86
-
87
-
88
-
89
-
90
-
91
-
92
-
93
-
94
-
95
-
96
-
97
-
98
-
99
-
100
-
101
-
102
-
103
-
104
-
105
-
106
-
107
-
108
-
109
-
110
-
111
-
112
-
113
-
114
-
115
-
116
-
117
-
118
-
119
-
120
-
121
-
122
-
123
-
124
-
125
-
126
-
127
-
128
-
129
-
130
-
131
-
132
-
133
-
134
-
135
-
136
-
137
-
138
-
139
-
140
-
141
-
142
-
143
-
144
-
145
-
146
-
147
-
148
-
149
-
150
-
151
-
152
-
153
-
154
-
155
-
156
-
157
-
158
-
159
-
160
-
161
-
162
-
163
-
164
-
165
-
166
-
167
-
168
-
169
-
170
-
171
-
172
-
173
 |
 |

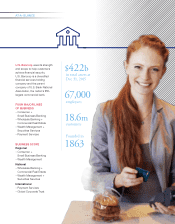
U.S.BANCORP 2015 ANNUAL REPORT
— 2 —
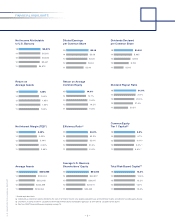
Net Income Attributable
to U.S.Bancorp
Diluted Earnings
per Common Share
Dividends Declared
per Common Share
15 $5,879
14 $5,851
13 $5,836
12 $5,647
11 $4,872
15 $3.16
14 $3.08
13 $3.00
12 $2.84
11 $2.46
15 $1.010
14 $.965
13 $.885
12 $.780
11 $.500
Return on
Average Assets
Return on Average
Common Equity Dividend Payout Ratio
15 1.44%
14 1.54%
13 1.65%
12 1.65%
11 1.53%
15 14.0%
14 14.7%
13 15.8%
12 16.2%
11 15.8%
15 31.8%
14 31.1%
13 29.3%
12 27.4%
11 20.2%
Net Interest Margin (TEB*) Efciency Ratio(a)
Common Equity
Tier 1 Capital(b)
15 3.05%
14 3.23%
13 3.44%
12 3.58%
11 3.65%
15 53.8%
14 53.2%
13 52.4%
12 51.5%
11 51.8%
15 9.6%
14 9.7%
13 9.4%(c)
12 9.0%(c)
11 8.6%(c)
Average Assets
Average U.S.Bancorp
Shareholders’ Equity Total Risk-Based Capital(b)
15 $408,865
14 $380,004
13 $352,680
12 $342,849
11 $318,264
15 $44,813
14 $42,837
13 $39,917
12 $ 37,611
11 $32,200
15 13.3%
14 13.6%
13 13.2%
12 13.1%
11 13.3%
* Taxable-equivalent basis.
(a) Computed as noninterest expense divided by the sum of net interest income on a taxable-equivalent basis and noninterest income excluding net securities gains (losses).
(b) December 31, 2015 and 2014, calculated under the Basel III transitional standardized approach; all other periods calculated under Basel I.
(c) See Non-GAAP Financial Measures beginning on page 73.
FINANCIAL HIGHLIGHTS