Tesco 2000 Annual Report Download - page 4
Download and view the complete annual report
Please find page 4 of the 2000 Tesco annual report below. You can navigate through the pages in the report by either clicking on the pages listed below, or by using the keyword search tool below to find specific information within the annual report.-
 1
1 -
 2
2 -
 3
3 -
 4
4 -
 5
5 -
 6
6 -
 7
7 -
 8
8 -
 9
9 -
 10
10 -
 11
11 -
 12
12 -
 13
13 -
 14
14 -
 15
15 -
16
-
17
-
18
-
19
-
20
-
21
-
22
-
23
-
24
-
25
-
26
-
27
-
28
-
29
-
30
-
31
-
32
-
33
-
34
-
35
-
36
-
37
-
38
-
39
-
40
-
41
-
42
-
43
-
44
 |
 |

TESCO PLC
2
operating and financial review
This operating and financial review analyses
the performance of Tesco in the financial
year ended 26 February 2000. It also
explains certain other aspects of the
Group’s results and operations including
taxation and treasury management.
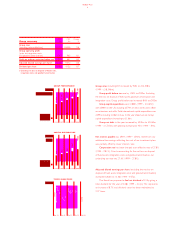
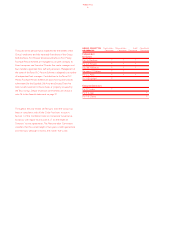
Group performance
Group sales including VAT increased by 9.8% to £20,358m
(1999 – £18,546m).
Group profit before tax rose by 10.8% to £933m. Excluding
the net loss on disposal of fixed assets, goodwill amortisation and
integration costs, Group profit before tax increased 8.4% to £955m.
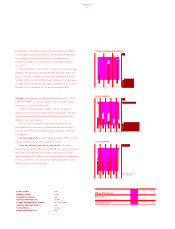
Group capital expenditure was £1,488m (1999 – £1,067m)
with £989m in the UK, including £579m on new stores and £182m
on extensions and refits. Total international capital expenditure was
£499m including £186m in Asia. In the year ahead we see Group
capital expenditure increasing to £1.6bn.
Group net debt in the year increased by £340m to £2,060m
(1999 – £1,720m), with gearing increasing to 43% (1999 – 39%).
Group interest and taxation
Net interest payable was £99m (1999 – £90m). Interest on our
additional borrowings, reflecting the cost of our investment plans,
was partially offset by lower interest rates.
Corporation tax has been charged at an effective rate of 27.8%
(1999 – 28.1%). Prior to accounting for the net loss on disposal
of fixed assets, integration costs and goodwill amortisation, our
underlying tax rate was 27.4% (1999 – 27.8%).
Shareholder returns and dividends
Adjusted diluted earnings per share (excluding the net loss on
disposal of fixed assets, integration costs and goodwill amortisation)
increased by 8.6% to 10.18p (1999 – 9.37p).
The Board has proposed a final net dividend of 3.14p giving a
total dividend for the year of 4.48p (1999 – 4.12p). This represents
an increase of 8.7% and dividend cover has been maintained at
2.27 times.
1996 1997 1998 1999 2000
13,028
14,984
17,447*
18,546
20,358
£m
Group sales
UK retail sales
GROUP PERFORMANCE
14,024
15,799*
17,070
2000 1999 Change
Group summary £m £m %
Group sales
(including value added tax) 20,358 18,546 9.8
Group operating profit
(prior to integration costs
and goodwill amortisation) 1,043 965 8.1
Profit on ordinary activities before tax†955 881 8.4
Adjusted diluted earnings per share†10.18p 9.37p 8.6
Dividend per share 4.48p 4.12p 8.7
† Excluding net loss on disposal of fixed assets,
integration costs and goodwill amortisation
*52 weeks pro forma
1996 1997 1998 1999 2000
666
758
841
1,067
1,488
£m
Group
UK
CAPITAL EXPENDITURE
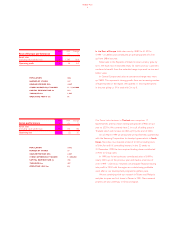
TESCO SHARE PRICE
18,331
12,430
848
757
682
608
989
Feb 00Dec 99Oct 99Jun 99Mar 99
177.0
169.0
Pence