Tesco 2000 Annual Report Download - page 26
Download and view the complete annual report
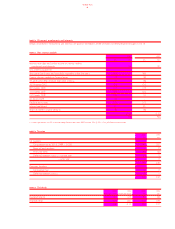
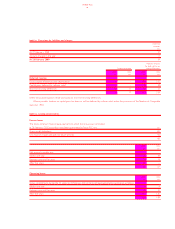
Please find page 26 of the 2000 Tesco annual report below. You can navigate through the pages in the report by either clicking on the pages listed below, or by using the keyword search tool below to find specific information within the annual report.-
 1
1 -
2
-
3
-
4
-
5
-
6
-
7
-
8
-
9
-
10
-
11
-
12
-
13
-
14
-
15
-
 16
16 -
 17
17 -
 18
18 -
 19
19 -
 20
20 -
 21
21 -
 22
22 -
 23
23 -
 24
24 -
 25
25 -
 26
26 -
 27
27 -
 28
28 -
 29
29 -
 30
30 -
 31
31 -
 32
32 -
 33
33 -
 34
34 -
 35
35 -
 36
36 -
37
-
38
-
39
-
40
-
41
-
42
-
43
-
44
 |
 |

TESCO PLC
24
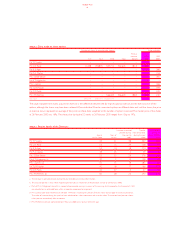
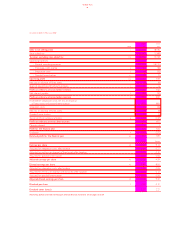
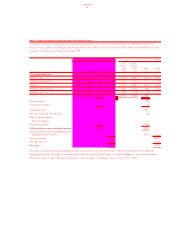
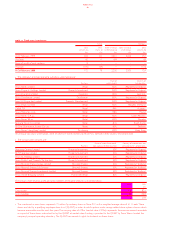
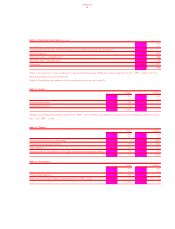
NOTE 1 Segmental analysis of sales, turnover, profit and net assets
The Group’s operations of retailing and associated activities and property development are carried out in the UK, Republic of Ireland,
France, Hungary, Poland, Czech Republic, Slovakia, South Korea and Thailand.The results for South Korea,Thailand and continental European
operations are for the year ended 31 December 1999.
2000 1999
Sales Turnover Sales Turnover
including excluding including excluding
VAT VAT Profit Assets VAT VAT Profit Assets
£m £m £m £m £m £m £m £m
Continuing operations
Retailing – UK 18,331 16,955 993 5,685 17,070 15,814 919 5,392
Property development 3 3 – 28 21 21 – 32
Total UK 18,334 16,958 993 5,713 17,091 15,835 919 5,424
Retailing – Rest of Europe 1,527 1,374 51 771 1,285 1,167 48 522
Retailing – Asia 497 464 (1) 374 170 156 (2) 151
20,358 18,796 1,043 18,546 17,158 965
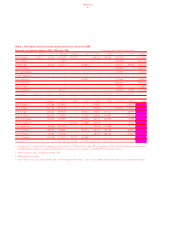
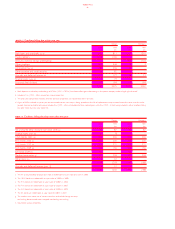
Integration costs (6) (26)
Goodwill amortisation (7) (5)
Operating profit 1,030 934
Net loss on disposal of fixed assets (9) (8)
Share of operating profit
from joint ventures 11 6
Net interest payable (99) (90)
Profit on ordinary activities before taxation 933 842
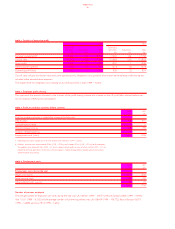
Operating margin (prior to integration costs
and goodwill amortisation) 5.5% 5.6%
Capital employed 6,858 6,097
Net debt (note 33) (2,060) (1,720)
Net assets 4,798 4,377
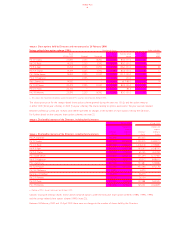
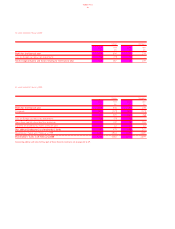
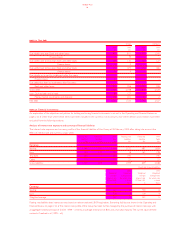
The analysis of capital employed by geographical area is calculated on net assets excluding net debt. Inter-segmental turnover between
the geographical areas of business is not material.Turnover is disclosed by origin.There is no material difference in turnover by destination.
The Group’s share of sales in the joint ventures which is not included in the numbers above is £74m (1999 – £49m).
notes to the financial statements