Telstra 2008 Annual Report Download - page 9
Download and view the complete annual report
Please find page 9 of the 2008 Telstra annual report below. You can navigate through the pages in the report by either clicking on the pages listed below, or by using the keyword search tool below to find specific information within the annual report.-
 1
1 -
 2
2 -
 3
3 -
 4
4 -
 5
5 -
 6
6 -
 7
7 -
 8
8 -
 9
9 -
 10
10 -
 11
11 -
 12
12 -
 13
13 -
 14
14 -
 15
15 -
 16
16 -
 17
17 -
 18
18 -
 19
19 -
 20
20 -
21
-
22
-
23
-
24
-
25
-
26
-
27
-
28
-
29
-
30
-
31
-
32
-
33
-
34
-
35
-
36
-
37
-
38
-
39
-
40
-
41
-
42
-
43
-
44
-
45
-
46
-
47
-
48
-
49
-
50
-
51
-
52
-
53
-
54
-
55
-
56
-
57
-
58
-
59
-
60
-
61
-
62
-
63
-
64
-
65
-
66
-
67
-
68
-
69
-
70
-
71
-
72
-
73
-
74
-
75
-
76
-
77
-
78
-
79
-
80
-
81
-
82
-
83
-
84
-
85
-
86
-
87
-
88
-
89
-
90
-
91
-
92
-
93
-
94
-
95
-
96
-
97
-
98
-
99
-
100
-
101
-
102
-
103
-
104
-
105
-
106
-
107
-
108
-
109
-
110
-
111
-
112
-
113
-
114
-
115
-
116
-
117
-
118
-
119
-
120
-
121
-
122
-
123
-
124
-
125
-
126
-
127
-
128
-
129
-
130
-
131
-
132
-
133
-
134
-
135
-
136
-
137
-
138
-
139
-
140
-
141
-
142
-
143
-
144
-
145
-
146
-
147
-
148
-
149
-
150
-
151
-
152
-
153
-
154
-
155
-
156
-
157
-
158
-
159
-
160
-
161
-
162
-
163
-
164
-
165
-
166
-
167
-
168
-
169
-
170
-
171
-
172
-
173
-
174
-
175
-
176
-
177
-
178
-
179
-
180
-
181
-
182
-
183
-
184
-
185
-
186
-
187
-
188
-
189
-
190
-
191
-
192
-
193
-
194
-
195
-
196
-
197
-
198
-
199
-
200
-
201
-
202
-
203
-
204
-
205
-
206
-
207
-
208
-
209
-
210
-
211
-
212
-
213
-
214
-
215
-
216
-
217
-
218
-
219
-
220
-
221
-
222
-
223
-
224
-
225
-
226
-
227
-
228
-
229
-
230
-
231
-
232
-
233
-
234
-
235
-
236
-
237
-
238
-
239
-
240
-
241
-
242
-
243
-
244
-
245
-
246
-
247
-
248
-
249
-
250
-
251
-
252
-
253
 |
 |

6
Telstra Corporation Limited and controlled entities
Full year results and operations review - June 2008
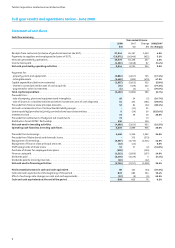
Statement of cash flows
(
Cash flow summary
Year ended 30 June
2008 2007 Change 2008/2007
$m $m $m (% change)
Receipts from customers (inclusive of goods and services tax GST) . . . . . . . . . . . . . . . 27,246 26,187 1,059 4.0%
Payments to suppliers and employees (inclusive of GST) . . . . . . . . . . . . . . . . . . . . . (16,871) (16,049) (822) 5.1%
Net cash generated by operations. . . . . . . . . . . . . . . . . . . . . . . . . . . . . . . . . . . 10,375 10,138 237 2.3%
Income taxes paid. . . . . . . . . . . . . . . . . . . . . . . . . . . . . . . . . . . . . . . . . . . . . (1,531) (1,618) 87 (5.4%)
Net cash provided by operating activities . . . . . . . . . . . . . . . . . . . . . . . . . . . . . 8,844 8,520 324 3.8%
Payments for: . . . . . . . . . . . . . . . . . . . . . . . . . . . . . . . . . . . . . . . . . . . . . . .
- property, plant and equipment. . . . . . . . . . . . . . . . . . . . . . . . . . . . . . . . . . . . (3,862) (4,657) 795 (17.1%)
- intangible assets. . . . . . . . . . . . . . . . . . . . . . . . . . . . . . . . . . . . . . . . . . . . . (1,465) (995) (470) 47.2%
Capital expenditure (before investments) . . . . . . . . . . . . . . . . . . . . . . . . . . . . . . (5,327) (5,652) 325 (5.8%)
- shares in controlled entities (net of cash acquired) . . . . . . . . . . . . . . . . . . . . . . . . (74) (326) 252 (77.3%)
- payments for other investments . . . . . . . . . . . . . . . . . . . . . . . . . . . . . . . . . . . (1) (4) 3 (75.0%)
Total capital expenditure . . . . . . . . . . . . . . . . . . . . . . . . . . . . . . . . . . . . . . . . (5,402) (5,982) 580 (9.7%)
Proceeds from: . . . . . . . . . . . . . . . . . . . . . . . . . . . . . . . . . . . . . . . . . . . . . . .
- sale of property, plant and equipment and intangibles . . . . . . . . . . . . . . . . . . . . . 29 34 (5) (14.7%)
- sale of shares in controlled entities and other investments (net of cash disposed) . . . . 51 232 (181) (78.0%)
Proceeds from finance lease principal amounts. . . . . . . . . . . . . . . . . . . . . . . . . . . 52 84 (32) (38.1%)
Net cash consideration from CSL New World Mobility merger . . . . . . . . . . . . . . . . . . -(21) 21 -
Loans repaid by/(provided to) jointly controlled and associated entities . . . . . . . . . . . 6(24) 30 (125.0%)
Interest received . . . . . . . . . . . . . . . . . . . . . . . . . . . . . . . . . . . . . . . . . . . . . . 72 56 16 28.6%
Proceeds from settlement of hedges in net investments . . . . . . . . . . . . . . . . . . . . . 73 -73 -
Distribution from FOXTEL† Partnership . . . . . . . . . . . . . . . . . . . . . . . . . . . . . . . . 130 -130 -
Net cash used in investing activities . . . . . . . . . . . . . . . . . . . . . . . . . . . . . . . . . (4,989) (5,621) 632 (11.2%)
Operating cash flows less investing cash flows . . . . . . . . . . . . . . . . . . . . . . . . . . 3,855 2,899 956 33.0%
Proceeds from borrowings . . . . . . . . . . . . . . . . . . . . . . . . . . . . . . . . . . . . . . . . 6,498 5,206 1,292 24.8%
Proceeds from Telstra bonds and domestic loans. . . . . . . . . . . . . . . . . . . . . . . . . . -373 (373) -
Repayment of borrowings . . . . . . . . . . . . . . . . . . . . . . . . . . . . . . . . . . . . . . . . (5,397) (3,776) (1,621) 42.9%
Repayment of finance lease principal amounts . . . . . . . . . . . . . . . . . . . . . . . . . . (42) (42) - 0.0%
Staff repayments of share loans . . . . . . . . . . . . . . . . . . . . . . . . . . . . . . . . . . . . 15 17 (2) (11.8%)
Purchase of shares for employee share plans . . . . . . . . . . . . . . . . . . . . . . . . . . . . (129) - (129) -
Finance costs paid. . . . . . . . . . . . . . . . . . . . . . . . . . . . . . . . . . . . . . . . . . . . . (1,213) (1,056) (157) 14.9%
Dividends paid . . . . . . . . . . . . . . . . . . . . . . . . . . . . . . . . . . . . . . . . . . . . . . . (3,476) (3,479) 3 (0.1%)
Dividends paid to minority interests. . . . . . . . . . . . . . . . . . . . . . . . . . . . . . . . . . (22) -(22) -
Net cash used in financing activities. . . . . . . . . . . . . . . . . . . . . . . . . . . . . . . . . (3,766) (2,757) (1,009) 36.6%
Net increase/(decrease) in cash and cash equivalent . . . . . . . . . . . . . . . . . . . . . . 89 142 (53) (37.3%)
Cash and cash equivalents at the beginning of the period . . . . . . . . . . . . . . . . . . . . 823 689 134 19.4%
Effect of exchange rate changes on cash and cash equivalents . . . . . . . . . . . . . . . . . (13) (8) (5) 62.5%
Cash and cash equivalents at the end of the period . . . . . . . . . . . . . . . . . . . . . . . 899 823 76 9.2%