Telstra 2008 Annual Report Download - page 15
Download and view the complete annual report
Please find page 15 of the 2008 Telstra annual report below. You can navigate through the pages in the report by either clicking on the pages listed below, or by using the keyword search tool below to find specific information within the annual report.-
 1
1 -
2
-
3
-
4
-
 5
5 -
 6
6 -
 7
7 -
 8
8 -
 9
9 -
 10
10 -
 11
11 -
 12
12 -
 13
13 -
 14
14 -
 15
15 -
 16
16 -
 17
17 -
 18
18 -
 19
19 -
 20
20 -
 21
21 -
 22
22 -
 23
23 -
 24
24 -
 25
25 -
26
-
27
-
28
-
29
-
30
-
31
-
32
-
33
-
34
-
35
-
36
-
37
-
38
-
39
-
40
-
41
-
42
-
43
-
44
-
45
-
46
-
47
-
48
-
49
-
50
-
51
-
52
-
53
-
54
-
55
-
56
-
57
-
58
-
59
-
60
-
61
-
62
-
63
-
64
-
65
-
66
-
67
-
68
-
69
-
70
-
71
-
72
-
73
-
74
-
75
-
76
-
77
-
78
-
79
-
80
-
81
-
82
-
83
-
84
-
85
-
86
-
87
-
88
-
89
-
90
-
91
-
92
-
93
-
94
-
95
-
96
-
97
-
98
-
99
-
100
-
101
-
102
-
103
-
104
-
105
-
106
-
107
-
108
-
109
-
110
-
111
-
112
-
113
-
114
-
115
-
116
-
117
-
118
-
119
-
120
-
121
-
122
-
123
-
124
-
125
-
126
-
127
-
128
-
129
-
130
-
131
-
132
-
133
-
134
-
135
-
136
-
137
-
138
-
139
-
140
-
141
-
142
-
143
-
144
-
145
-
146
-
147
-
148
-
149
-
150
-
151
-
152
-
153
-
154
-
155
-
156
-
157
-
158
-
159
-
160
-
161
-
162
-
163
-
164
-
165
-
166
-
167
-
168
-
169
-
170
-
171
-
172
-
173
-
174
-
175
-
176
-
177
-
178
-
179
-
180
-
181
-
182
-
183
-
184
-
185
-
186
-
187
-
188
-
189
-
190
-
191
-
192
-
193
-
194
-
195
-
196
-
197
-
198
-
199
-
200
-
201
-
202
-
203
-
204
-
205
-
206
-
207
-
208
-
209
-
210
-
211
-
212
-
213
-
214
-
215
-
216
-
217
-
218
-
219
-
220
-
221
-
222
-
223
-
224
-
225
-
226
-
227
-
228
-
229
-
230
-
231
-
232
-
233
-
234
-
235
-
236
-
237
-
238
-
239
-
240
-
241
-
242
-
243
-
244
-
245
-
246
-
247
-
248
-
249
-
250
-
251
-
252
-
253
 |
 |

12
Telstra Corporation Limited and controlled entities
Full year results and operations review - June 2008
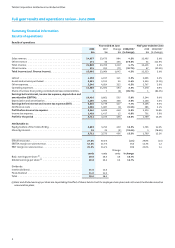
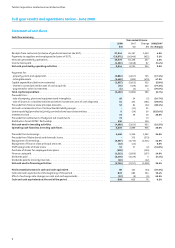
Fixed telephony
• PSTN revenue decline further slowed to 3.2%
• Retail access lines grew by 87k
• PSTN ARPU substantially maintained
• Wholesale business driving PSTN reduction through losses to ULL
PSTN products
(i) Includes local calls, national long distance and international direct minutes from our public switched telephone network (PSTN) and independently operated payphones.
Excludes minutes related to calls from non-PSTN networks, such as mobiles, ISDN and virtual private networks.
Fixed telephony
Year ended 30 June
2008 2007 Change 2008/2007
$m $m $m (% change)
PSTN products . . . . . . . . . . . . . . . . . . . . . . . . . . . . . . . . . . . . . . . . . . . . . . . 6,666 6,887 (221) (3.2%)
ISDN products . . . . . . . . . . . . . . . . . . . . . . . . . . . . . . . . . . . . . . . . . . . . . . . 978 1,014 (36) (3.6%)
Premium calling products . . . . . . . . . . . . . . . . . . . . . . . . . . . . . . . . . . . . . . . . 440 444 (4) (0.9%)
Payphones . . . . . . . . . . . . . . . . . . . . . . . . . . . . . . . . . . . . . . . . . . . . . . . . . 70 85 (15) (17.6%)
Customer premises equipment . . . . . . . . . . . . . . . . . . . . . . . . . . . . . . . . . . . . . 334 325 9 2.8%
Intercarrier access services. . . . . . . . . . . . . . . . . . . . . . . . . . . . . . . . . . . . . . . . 265 190 75 39.5%
Other fixed telephony . . . . . . . . . . . . . . . . . . . . . . . . . . . . . . . . . . . . . . . . . . 196 218 (22) (10.1%)
Total fixed telephony revenue. . . . . . . . . . . . . . . . . . . . . . . . . . . . . . . . . . . . . 8,949 9,163 (214) (2.3%)
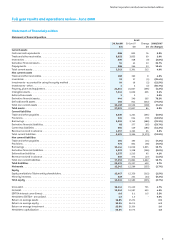
PSTN products
Year ended 30 June
2008 2007 Change 2008/2007
$m $m $m (% change)
Basic access:
- Retail . . . . . . . . . . . . . . . . . . . . . . . . . . . . . . . . . . . . . . . . . . . . . . . . . . . . 2,667 2,587 80 3.1%
- Domestic wholesale . . . . . . . . . . . . . . . . . . . . . . . . . . . . . . . . . . . . . . . . . . . 611 746 (135) (18.1%)
Total basic access revenue. . . . . . . . . . . . . . . . . . . . . . . . . . . . . . . . . . . . . . . . 3,278 3,333 (55) (1.7%)
Local calls . . . . . . . . . . . . . . . . . . . . . . . . . . . . . . . . . . . . . . . . . . . . . . . . . . 736 845 (109) (12.9%)
PSTN value added services. . . . . . . . . . . . . . . . . . . . . . . . . . . . . . . . . . . . . . . . 269 257 12 4.7%
National long distance calls. . . . . . . . . . . . . . . . . . . . . . . . . . . . . . . . . . . . . . . 749 808 (59) (7.3%)
Fixed to mobile. . . . . . . . . . . . . . . . . . . . . . . . . . . . . . . . . . . . . . . . . . . . . . . 1,222 1,208 14 1.2%
International direct . . . . . . . . . . . . . . . . . . . . . . . . . . . . . . . . . . . . . . . . . . . . 181 184 (3) (1.6%)
Fixed interconnection . . . . . . . . . . . . . . . . . . . . . . . . . . . . . . . . . . . . . . . . . . 231 252 (21) (8.3%)
Total PSTN products revenue. . . . . . . . . . . . . . . . . . . . . . . . . . . . . . . . . . . . . . 6,666 6,887 (221) (3.2%)
PSTN retail versus wholesale revenue
Retail. . . . . . . . . . . . . . . . . . . . . . . . . . . . . . . . . . . . . . . . . . . . . . . . . . . . . 5,723 5,731 (8) (0.1%)
Wholesale . . . . . . . . . . . . . . . . . . . . . . . . . . . . . . . . . . . . . . . . . . . . . . . . . . 943 1,156 (213) (18.4%)
Basic access lines in service (in millions)
Residential . . . . . . . . . . . . . . . . . . . . . . . . . . . . . . . . . . . . . . . . . . . . . . . . . 5.56 5.56 - 0.0%
Business . . . . . . . . . . . . . . . . . . . . . . . . . . . . . . . . . . . . . . . . . . . . . . . . . . . 2.31 2.22 0.09 4.1%
Total retail . . . . . . . . . . . . . . . . . . . . . . . . . . . . . . . . . . . . . . . . . . . . . . . . . 7.87 7.78 0.09 1.2%
Domestic wholesale. . . . . . . . . . . . . . . . . . . . . . . . . . . . . . . . . . . . . . . . . . . . 1.50 1.98 (0.48) (24.2%)
Total access lines in service . . . . . . . . . . . . . . . . . . . . . . . . . . . . . . . . . . . . . . . 9.37 9.76 (0.39) (4.0%)
Average revenue per user per month $'s . . . . . . . . . . . . . . . . . . . . . . . . . . . . . . . 58.11 58.26 (0.15) (0.3%)
Number of local calls (in millions) (i) . . . . . . . . . . . . . . . . . . . . . . . . . . . . . . . . . . 5,680 6,528 (848) (13.0%)
National long distance minutes (in millions) (i) . . . . . . . . . . . . . . . . . . . . . . . . . . . 6,947 7,130 (183) (2.6%)
Fixed to mobile minutes (in millions) . . . . . . . . . . . . . . . . . . . . . . . . . . . . . . . . . 3,410 3,389 21 0.6%
International direct minutes (in millions) (i) . . . . . . . . . . . . . . . . . . . . . . . . . . . . . 548 528 20 3.8%
Note: statistical data represents management's best estimates.