Telstra 2008 Annual Report Download - page 18
Download and view the complete annual report
Please find page 18 of the 2008 Telstra annual report below. You can navigate through the pages in the report by either clicking on the pages listed below, or by using the keyword search tool below to find specific information within the annual report.-
 1
1 -
2
-
3
-
4
-
5
-
6
-
7
-
 8
8 -
 9
9 -
 10
10 -
 11
11 -
 12
12 -
 13
13 -
 14
14 -
 15
15 -
 16
16 -
 17
17 -
 18
18 -
 19
19 -
 20
20 -
 21
21 -
 22
22 -
 23
23 -
 24
24 -
 25
25 -
 26
26 -
 27
27 -
 28
28 -
29
-
30
-
31
-
32
-
33
-
34
-
35
-
36
-
37
-
38
-
39
-
40
-
41
-
42
-
43
-
44
-
45
-
46
-
47
-
48
-
49
-
50
-
51
-
52
-
53
-
54
-
55
-
56
-
57
-
58
-
59
-
60
-
61
-
62
-
63
-
64
-
65
-
66
-
67
-
68
-
69
-
70
-
71
-
72
-
73
-
74
-
75
-
76
-
77
-
78
-
79
-
80
-
81
-
82
-
83
-
84
-
85
-
86
-
87
-
88
-
89
-
90
-
91
-
92
-
93
-
94
-
95
-
96
-
97
-
98
-
99
-
100
-
101
-
102
-
103
-
104
-
105
-
106
-
107
-
108
-
109
-
110
-
111
-
112
-
113
-
114
-
115
-
116
-
117
-
118
-
119
-
120
-
121
-
122
-
123
-
124
-
125
-
126
-
127
-
128
-
129
-
130
-
131
-
132
-
133
-
134
-
135
-
136
-
137
-
138
-
139
-
140
-
141
-
142
-
143
-
144
-
145
-
146
-
147
-
148
-
149
-
150
-
151
-
152
-
153
-
154
-
155
-
156
-
157
-
158
-
159
-
160
-
161
-
162
-
163
-
164
-
165
-
166
-
167
-
168
-
169
-
170
-
171
-
172
-
173
-
174
-
175
-
176
-
177
-
178
-
179
-
180
-
181
-
182
-
183
-
184
-
185
-
186
-
187
-
188
-
189
-
190
-
191
-
192
-
193
-
194
-
195
-
196
-
197
-
198
-
199
-
200
-
201
-
202
-
203
-
204
-
205
-
206
-
207
-
208
-
209
-
210
-
211
-
212
-
213
-
214
-
215
-
216
-
217
-
218
-
219
-
220
-
221
-
222
-
223
-
224
-
225
-
226
-
227
-
228
-
229
-
230
-
231
-
232
-
233
-
234
-
235
-
236
-
237
-
238
-
239
-
240
-
241
-
242
-
243
-
244
-
245
-
246
-
247
-
248
-
249
-
250
-
251
-
252
-
253
 |
 |

15
Telstra Corporation Limited and controlled entities
Full year results and operations review - June 2008
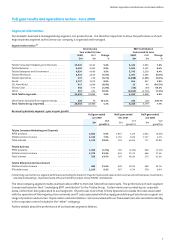
Mobiles1
• Our 3GSM customer base now represents 46.6% of our total mobile base
• Mobiles services revenue grew by 12.3%, mobile non-messaging data accounts for 57.1% of this growth
• Our blended ARPU grew by 7.8% to $49.48
Since our initial investment in the Next G™ network in October 2006, we have been driving a significant increase of the Australian
market penetration of 3GSM subscribers which now represents 46.6% of our total mobile base, up from 3.7% at the end of fiscal
2006. Penetration has more than doubled in the year as we added 2.3 million 3GSM services in operation (SIOs). Over the last two
financial years, our Australian mobile business has achieved world-leading revenue growth in an already highly penetrated
market.
In fiscal 2008, our mobile services revenue growth was 12.3%, boosted by a 7.8% increase in ARPU and a 1.3% increase in SIOs.
Furthermore, we have delivered our third consecutive half-year of double digit growth in mobile services revenue. At the same
time, we have focused on reducing associated costs. As a result, total subscriber acquisition and recontract costs (SARCs) as a
proportion of our retail domestic mobile services revenue has fallen over the year from 17.1% to 13.8%.
1. Mobiles revenue includes total revenue from wireless broadband and data packs.
Mobiles
Year ended 30 June
2008 2007 Change 2008/2007
$m $m $m (% change)
Access fees and call charges. . . . . . . . . . . . . . . . . . . . . . . . . . . . . . . . . . . . . . . 2,700 2,664 36 1.4%
International roaming . . . . . . . . . . . . . . . . . . . . . . . . . . . . . . . . . . . . . . . . . . 404 327 77 23.5%
Mobile messagebank . . . . . . . . . . . . . . . . . . . . . . . . . . . . . . . . . . . . . . . . . . . 266 231 35 15.2%
Mobile data
- Messaging. . . . . . . . . . . . . . . . . . . . . . . . . . . . . . . . . . . . . . . . . . . . . . . . . 740 615 125 20.3%
- Non-messaging (i) . . . . . . . . . . . . . . . . . . . . . . . . . . . . . . . . . . . . . . . . . . . . 806 458 348 76.0%
Total mobile data (i) . . . . . . . . . . . . . . . . . . . . . . . . . . . . . . . . . . . . . . . . . . . . 1,546 1,073 473 44.1%
Total mobile services revenue - retail . . . . . . . . . . . . . . . . . . . . . . . . . . . . . . . . . 4,916 4,295 621 14.5%
Mobiles interconnection . . . . . . . . . . . . . . . . . . . . . . . . . . . . . . . . . . . . . . . . . 590 593 (3) (0.5%)
5,506 4,888 618 12.6%
Mobile services revenue - wholesale resale . . . . . . . . . . . . . . . . . . . . . . . . . . . . . 42 51 (9) (17.6%)
Total mobile services revenue. . . . . . . . . . . . . . . . . . . . . . . . . . . . . . . . . . . . . . 5,548 4,939 609 12.3%
Mobile handset sales . . . . . . . . . . . . . . . . . . . . . . . . . . . . . . . . . . . . . . . . . . . 828 718 110 15.3%
Total mobile revenue . . . . . . . . . . . . . . . . . . . . . . . . . . . . . . . . . . . . . . . . . . 6,376 5,657 719 12.7%
Mobile services retail postpaid and prepaid revenue
Postpaid . . . . . . . . . . . . . . . . . . . . . . . . . . . . . . . . . . . . . . . . . . . . . . . . . . . 4,384 3,781 603 15.9%
Prepaid. . . . . . . . . . . . . . . . . . . . . . . . . . . . . . . . . . . . . . . . . . . . . . . . . . . . 532 514 18 3.5%
Total mobiles retail and wholesale revenue
Retail. . . . . . . . . . . . . . . . . . . . . . . . . . . . . . . . . . . . . . . . . . . . . . . . . . . . . 6,226 5,563 663 11.9%
Wholesale . . . . . . . . . . . . . . . . . . . . . . . . . . . . . . . . . . . . . . . . . . . . . . . . . . 150 94 56 59.6%
Postpaid mobile SIOs (thousands) . . . . . . . . . . . . . . . . . . . . . . . . . . . . . . . . . . . 6,087 5,515 572 10.4%
Prepaid mobile SIOs (thousands). . . . . . . . . . . . . . . . . . . . . . . . . . . . . . . . . . . . 3,248 3,697 (449) (12.1%)
Total mobile SIOs (thousands). . . . . . . . . . . . . . . . . . . . . . . . . . . . . . . . . . . . . 9,335 9,212 123 1.3%
3GSM Postpaid mobile SIOs (thousands) . . . . . . . . . . . . . . . . . . . . . . . . . . . . . . . 3,874 1,984 1,890 95.3%
3GSM Prepaid mobile SIOs (thousands). . . . . . . . . . . . . . . . . . . . . . . . . . . . . . . . 478 19 459 2415.8%
3GSM Total mobile SIOs (thousands) . . . . . . . . . . . . . . . . . . . . . . . . . . . . . . . . 4,352 2,003 2,349 117.3%
Wholesale SIOs (thousands) (included in total SIOs above) . . . . . . . . . . . . . . . . . . . 74 131 (57) (43.5%)
Blended average revenue per user (including interconnection) . . . . . . . . . . . . . . . . . 49.48 45.92 3.56 7.8%
Prepaid average revenue per user . . . . . . . . . . . . . . . . . . . . . . . . . . . . . . . . . . . 12.78 11.74 1.04 8.9%
Postpaid average revenue per user . . . . . . . . . . . . . . . . . . . . . . . . . . . . . . . . . . 62.97 60.32 2.65 4.4%
3GSM average revenue per user . . . . . . . . . . . . . . . . . . . . . . . . . . . . . . . . . . . . 73.74 73.08 0.66 0.9%