Telstra 2008 Annual Report Download - page 11
Download and view the complete annual report
Please find page 11 of the 2008 Telstra annual report below. You can navigate through the pages in the report by either clicking on the pages listed below, or by using the keyword search tool below to find specific information within the annual report.-
 1
1 -
 2
2 -
 3
3 -
 4
4 -
 5
5 -
 6
6 -
 7
7 -
 8
8 -
 9
9 -
 10
10 -
 11
11 -
 12
12 -
 13
13 -
 14
14 -
 15
15 -
 16
16 -
 17
17 -
 18
18 -
 19
19 -
 20
20 -
 21
21 -
 22
22 -
23
-
24
-
25
-
26
-
27
-
28
-
29
-
30
-
31
-
32
-
33
-
34
-
35
-
36
-
37
-
38
-
39
-
40
-
41
-
42
-
43
-
44
-
45
-
46
-
47
-
48
-
49
-
50
-
51
-
52
-
53
-
54
-
55
-
56
-
57
-
58
-
59
-
60
-
61
-
62
-
63
-
64
-
65
-
66
-
67
-
68
-
69
-
70
-
71
-
72
-
73
-
74
-
75
-
76
-
77
-
78
-
79
-
80
-
81
-
82
-
83
-
84
-
85
-
86
-
87
-
88
-
89
-
90
-
91
-
92
-
93
-
94
-
95
-
96
-
97
-
98
-
99
-
100
-
101
-
102
-
103
-
104
-
105
-
106
-
107
-
108
-
109
-
110
-
111
-
112
-
113
-
114
-
115
-
116
-
117
-
118
-
119
-
120
-
121
-
122
-
123
-
124
-
125
-
126
-
127
-
128
-
129
-
130
-
131
-
132
-
133
-
134
-
135
-
136
-
137
-
138
-
139
-
140
-
141
-
142
-
143
-
144
-
145
-
146
-
147
-
148
-
149
-
150
-
151
-
152
-
153
-
154
-
155
-
156
-
157
-
158
-
159
-
160
-
161
-
162
-
163
-
164
-
165
-
166
-
167
-
168
-
169
-
170
-
171
-
172
-
173
-
174
-
175
-
176
-
177
-
178
-
179
-
180
-
181
-
182
-
183
-
184
-
185
-
186
-
187
-
188
-
189
-
190
-
191
-
192
-
193
-
194
-
195
-
196
-
197
-
198
-
199
-
200
-
201
-
202
-
203
-
204
-
205
-
206
-
207
-
208
-
209
-
210
-
211
-
212
-
213
-
214
-
215
-
216
-
217
-
218
-
219
-
220
-
221
-
222
-
223
-
224
-
225
-
226
-
227
-
228
-
229
-
230
-
231
-
232
-
233
-
234
-
235
-
236
-
237
-
238
-
239
-
240
-
241
-
242
-
243
-
244
-
245
-
246
-
247
-
248
-
249
-
250
-
251
-
252
-
253
 |
 |

8
Telstra Corporation Limited and controlled entities
Full year results and operations review - June 2008
Telstra Consumer Marketing and Channels
Our consumer segment continues to benefit from the introduction of customer segmentation and market based management.
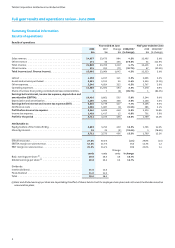
Total income grew by 5.3%, sales revenue was up 6.1% while EBIT contribution grew by 7.6%.
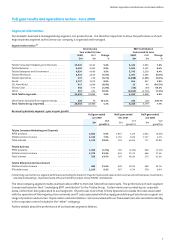
PSTN revenues in this segment have grown by 0.5% in fiscal 2008 to $3,861 million with basic access SIOs increasing 56k to 5.56
million. PSTN SIOs have grown in 20 out of the past 21 months and there are now 584k or 10.5% of residential customers on
subscription pricing plans. Finally, PSTN resale churn out continues to decline, finishing the year below 5% which is evidence of
growing customer satisfaction with the products and services we offer.
Our consumer segment has also experienced another strong year in its mobiles business with mobile services revenue growing at
7.0% for the year to $3,432 million. Postpaid subscribers continued to grow with over 200k customers added during the year. There
are now 72.2% of postpaid customers on the 3GSM network, up 27.9 percentage points from the end of fiscal 2007. Mobile data
revenue grew 34.8% driven by the increase in customers on the Next G™ network. Internet revenue also grew 38.0% to $1,478
million due to increases in both fixed and wireless broadband.
Total external expenses in our consumer segment have increased by only 1.5% for the year resulting in a 0.9 percentage point
improvement in the EBIT contribution margin. Higher service contract costs supporting revenue growth were offset by a decrease
in goods and services purchased in the year due to improved subscriber acquisition and recontract costs (SARC) management.
Telstra Business
In the second half of fiscal 2008, our business segment has built on its strong momentum of the first half. For the full year, total
income grew 8.8%, sales revenue grew 8.6% and EBIT contribution was up 8.4%.
Drivers of this impressive growth include a 19.5% increase in mobile services revenue and a 25.8% increase in IP and data access
revenues. More than half of our business segment revenues remain in fixed telephony, so a small increase of 0.9% in this business
in fiscal 2008 was very encouraging and included just a 1.5% decline in PSTN revenues in the year and a 1.1% decline in the second
half.
PSTN basic access SIO’s increased 30k to 1.61 million during the year driven by strong resale churn in. In the mobile business, 3GSM
subscribers now represent 64.9% of the postpaid mobile SIO base, while 3GSM ARPU increased by 14.7% for the year partly driven
by strong growth in data revenue.
The growth of 43.5% in internet revenues continues to be driven primarily by the performance of wireless broadband. For high-end
business customers, we have also seen strong growth in both Internet Direct and IP Access portfolios, highlighting our success in
selling the benefits of the Telstra Next IP® network.
Growth in external expenses for the year largely matched revenue growth, with the EBIT contribution margin declining just 0.1
percentage point on the year.
Telstra Enterprise and Government
Our enterprise and government segment (E&G) achieved an outstanding year of profitable growth. Total income rose 3.5% for the
year, sales revenue was up 3.6% and EBIT contribution grew by 8.4%. In the first half, total income growth was 4.4% with the
revenue slowdown in the second half of the year primarily due to a changing product mix, product simplification and the sales of
non-core businesses.
In terms of trends on key products, E&G exemplifies the success of our network transformation programme with resilient
performance in the core carriage business comprising fixed (excluding CPE), mobile services and IP and data access revenues.
IP and data access had a strong year growing at 6.2%. Growth in IP solutions, which have benefited from the launch of the Telstra
Next IP® network, have more than compensated for the declining revenues from our legacy data networks.
Mobile services revenue growth was 21.6% driven by ARPU and SIO growth with very strong performance in mobile data and
growing voice revenues. Non-SMS mobile data now represents 31.8% of total mobile revenue in this segment.
Our external expenses in this segment have decreased by 2.8% to $1,881 million. These results have been driven by an 11.1%
decrease in our labour costs offset by higher goods and services purchased. Labour costs have decreased as we have taken staff
out of the business following a review of our service offerings, whilst cost of goods sold increased due to higher mobile activity.