Telstra 2000 Annual Report Download - page 4
Download and view the complete annual report
Please find page 4 of the 2000 Telstra annual report below. You can navigate through the pages in the report by either clicking on the pages listed below, or by using the keyword search tool below to find specific information within the annual report.-
 1
1 -
 2
2 -
 3
3 -
 4
4 -
 5
5 -
 6
6 -
 7
7 -
 8
8 -
 9
9 -
 10
10 -
 11
11 -
 12
12 -
 13
13 -
 14
14 -
 15
15 -
16
-
17
-
18
-
19
-
20
-
21
-
22
-
23
-
24
-
25
-
26
-
27
-
28
-
29
-
30
-
31
-
32
-
33
-
34
-
35
-
36
-
37
-
38
-
39
-
40
-
41
-
42
-
43
-
44
-
45
-
46
-
47
-
48
-
49
-
50
-
51
-
52
-
53
-
54
-
55
-
56
-
57
-
58
-
59
-
60
-
61
-
62
 |
 |

2
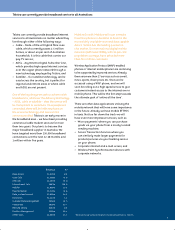
Strong earnings
creating shareholder value.
Financial Highlights
The strong performance of the company in the past
12 months is reflected in the following:
•Earnings per share before abnormals: Increased by 16 per cent to 31.4 cents.
•Total revenue: Increased by 8.9 per cent to $19.8 billion.
•Operating profit after tax: Grew by 5.5 per cent to $3.7 billion.
cents cents
Earnings per share (before abnormals)
Consolidated Profit and Loss 2000 1999 change
$m $m %
Total revenue 19,840 18,218 8.9
Operating expenses 13,919 12,898 7.9
Operating profit before income tax expense 5,921 5,320 11.3
Profit after tax and minority interest before abnormals 4,043 3,486 16.0
Abnormal items (net of tax) 366 – –
Operating profit after tax and minority interests 3,677 3,486 5.5
Retained profits 5,170 3,809 35.7
Earnings per share 28.6¢ 27.1¢ 5.5
Normal dividends per share 18.0¢ 17.0¢ 5.9
Special dividend – 16.0¢ –
Return on average assets 23.2% 22.5% 3.1
Number of full-time employees 50,761 52,840 (3.9)
18
17*
14
9*
1997
1998
1999
2000
31.4
27.1
23.3
20.0
1997
1998
1999
2000
Ordinary dividends per share
* excludes special dividend.