TD Bank 2010 Annual Report Download - page 11
Download and view the complete annual report
Please find page 11 of the 2010 TD Bank annual report below. You can navigate through the pages in the report by either clicking on the pages listed below, or by using the keyword search tool below to find specific information within the annual report.-
 1
1 -
 2
2 -
 3
3 -
 4
4 -
 5
5 -
 6
6 -
 7
7 -
 8
8 -
 9
9 -
 10
10 -
 11
11 -
 12
12 -
 13
13 -
 14
14 -
 15
15 -
 16
16 -
 17
17 -
 18
18 -
 19
19 -
 20
20 -
 21
21 -
 22
22 -
23
-
24
-
25
-
26
-
27
-
28
-
29
-
30
-
31
-
32
-
33
-
34
-
35
-
36
-
37
-
38
-
39
-
40
-
41
-
42
-
43
-
44
-
45
-
46
-
47
-
48
-
49
-
50
-
51
-
52
-
53
-
54
-
55
-
56
-
57
-
58
-
59
-
60
-
61
-
62
-
63
-
64
-
65
-
66
-
67
-
68
-
69
-
70
-
71
-
72
-
73
-
74
-
75
-
76
-
77
-
78
-
79
-
80
-
81
-
82
-
83
-
84
-
85
-
86
-
87
-
88
-
89
-
90
-
91
-
92
-
93
-
94
-
95
-
96
-
97
-
98
-
99
-
100
-
101
-
102
-
103
-
104
-
105
-
106
-
107
-
108
-
109
-
110
-
111
-
112
-
113
-
114
-
115
-
116
-
117
-
118
-
119
-
120
-
121
-
122
-
123
-
124
-
125
-
126
-
127
-
128
-
129
-
130
-
131
-
132
-
133
-
134
-
135
-
136
-
137
-
138
-
139
-
140
-
141
-
142
-
143
-
144
-
145
-
146
-
147
-
148
-
149
-
150
-
151
-
152
 |
 |

TD BANK GROUP ANNUAL REPORT 2010 MANAGEMENT’S DISCUSSION AND ANALYSIS 9
Bank removes “items of note,” net of income taxes, from reported
results. The items of note relate to items which management does not
believe are indicative of underlying business performance. The Bank
believes that adjusted results provide the reader with a better under-
standing of how management views the Bank’s performance. The
items of note are listed in the table on the following page. As explained,
adjusted results are different from reported results determined in
accordance with GAAP. Adjusted results, items of note, and related
terms used in this document are not defined terms under GAAP and,
therefore, may not be comparable to similar terms used by other issuers.
Effective April 30, 2009, the reporting periods of TD Bank, N.A.,
which operates as TD Bank, America’s Most Convenient Bank, were
aligned with the reporting period of the Bank to eliminate the one
month lag in financial reporting. Prior to April 30, 2009, the reporting
period of TD Bank, N.A. was included in the Bank’s financial state-
ments on a one month lag. In accordance with the CICA Handbook
Section 1506, Accounting Changes, this alignment is considered a
change in accounting policy. The Bank has assessed that the impact
to prior periods is not material and therefore, an adjustment was
made to opening retained earnings of the second quarter of 2009,
to
align the reporting period of TD Bank, N.A. to that of the Bank’s
reporting period.
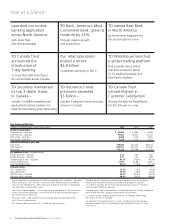
The following table provides the operating results – reported
for the Bank.
FINANCIAL RESULTS OVERVIEW
CORPORATE OVERVIEW
The Toronto-Dominion Bank and its subsidiaries are collectively known
as TD Bank Group (TD or the Bank). TD is the sixth largest bank in
North America by branches and serves approximately 19 million
customers in four key businesses operating in a number of locations
in key financial centres around the globe: Canadian Personal and
Commercial Banking, including TD Canada Trust and TD Insurance;
Wealth Management, including TD Waterhouse and an investment
in TD Ameritrade; U.S. Personal and Commercial Banking, including
TD Bank, America’s Most Convenient Bank; and Wholesale Banking,
including TD Securities. TD also ranks among the world’s leading online
financial services firms, with more than 6 million online customers. TD
had $620 billion in assets on October 31, 2010. The Toronto-Dominion
Bank trades under the symbol “TD” on the Toronto and New York
Stock Exchanges.
HOW THE BANK REPORTS
The Bank prepares its Consolidated Financial Statements in accordance
with GAAP and refers to results prepared in accordance with GAAP as
“reported” results. The Bank also utilizes non-GAAP financial measures
to arrive at “adjusted” results to assess each of its businesses and to
measure overall Bank performance. To arrive at adjusted results, the
(millions of Canadian dollars) 2010 2009 2008
Net interest income $ 11,543 $ 11,326 $ 8,532
Non-interest income 8,022 6,534 6,137
Total revenue 19,565 17,860 14,669
Provision for credit losses 1,625 2,480 1,063
Non-interest expenses 12,163 12,211 9,502
Income before income taxes, non-controlling interests in subsidiaries,
and equity in net income of associated company 5,777 3,169 4,104
Provision for income taxes 1,262 241 537
Non-controlling interests in subsidiaries, net of income taxes 106 111 43
Equity in net income of an associated company, net of income taxes 235 303 309
Net income – reported 4,644 3,120 3,833
Preferred dividends 194 167 59
Net income available to common shareholders – reported $ 4,450 $ 2,953 $ 3,774
OPERATING RESULTS – REPORTED
TABLE 1