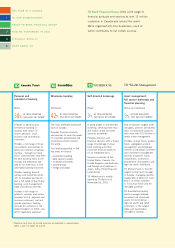
TD Bank 2001 Annual Report Download - page 4
Download and view the complete annual report
Please find page 4 of the 2001 TD Bank annual report below. You can navigate through the pages in the report by either clicking on the pages listed below, or by using the keyword search tool below to find specific information within the annual report.-
 1
1 -
 2
2 -
 3
3 -
 4
4 -
 5
5 -
 6
6 -
 7
7 -
 8
8 -
 9
9 -
 10
10 -
 11
11 -
 12
12 -
 13
13 -
 14
14 -
 15
15 -
16
-
17
-
18
-
19
-
20
-
21
-
22
-
23
-
24
-
25
-
26
-
27
-
28
-
29
-
30
-
31
-
32
-
33
-
34
-
35
-
36
-
37
-
38
-
39
-
40
-
41
-
42
-
43
-
44
-
45
-
46
-
47
-
48
-
49
-
50
-
51
-
52
-
53
-
54
-
55
-
56
-
57
-
58
-
59
-
60
-
61
-
62
-
63
-
64
-
65
-
66
-
67
-
68
-
69
-
70
-
71
-
72
-
73
-
74
-
75
-
76
-
77
-
78
-
79
-
80
-
81
-
82
-
83
-
84
-
85
-
86
-
87
-
88
 |
 |

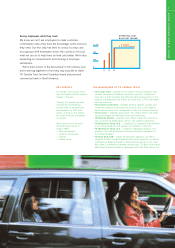
1.3
1.6
1.9
$2.2
1.0
97 98 99 00 01
1.25
2.00
2.75
$3.50
.50
97 98 99 00 01
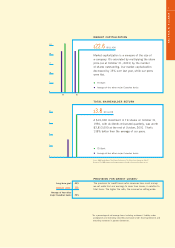
Key performance measures and goals
OPERATING CASH BASIS EFFICIENCY
RATIO FOR TD CANADA TRUST
The efficiency ratio measures how much in non-interest expenses
we spend to generate one dollar of revenue, which tells us how
efficiently we're operating. The lower the percentage, the greater
our efficiency. Our efficiency ratio goal has been established for
TD Canada Trust, as the efficiency ratio is a more relevant measure
for retail banking operations. Our goal for 2002 is 58.5% on an
operating cash basis and excluding funding costs related to the
Canada Trust acquisition.
OPERATING CASH BASIS RETURN ON EQUITY
Operating cash basis return on equity, or ROE, broadly measures
how effectively we use the money our shareholders invest
in us. Our ROE goal takes into consideration our outlook for
economic business conditions in each of the markets in which
our businesses operate.
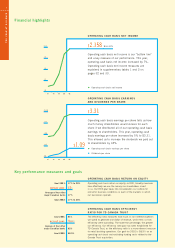
Financial highlights
OPERATING CASH BASIS EARNINGS
AND DIVIDENDS PER SHARE
$3.31
Operating cash basis earnings per share tells us how
much money shareholders would receive for each
share if we distributed all of our operating cash basis
earnings to shareholders. This year, operating cash
basis earnings per share increased by 5% to $3.31.
This allowed us to increase the dividends we paid out
to shareholders by 18%.
Operating cash basis earnings per share
Dividends per share
OPERATING CASH BASIS NET INCOME
$2.158 BILLION
Operating cash basis net income is our “bottom line”
and a key measure of our performance. This year,
operating cash basis net income increased by 7%.
Operating cash basis net income measures are
explained in supplementary tables 1 and 2 on
pages 32 and 33.
Operating cash basis net income
Goal 2001: 17% to 20%
RESULT 2001: 18%
Average of four other
major Canadian banks 17%
Goal 2002: 17% to 20%
Goal 2001: 61%
RESULT 2001: 59.6%
Average of four other
major Canadian banks 62%
Goal 2002: 58.5%
2
THE YEAR AT A GLANCE
$1.09