Sunoco 2009 Annual Report Download - page 12
Download and view the complete annual report
Please find page 12 of the 2009 Sunoco annual report below. You can navigate through the pages in the report by either clicking on the pages listed below, or by using the keyword search tool below to find specific information within the annual report.-
 1
1 -
 2
2 -
 3
3 -
 4
4 -
 5
5 -
 6
6 -
 7
7 -
 8
8 -
 9
9 -
 10
10 -
 11
11 -
 12
12 -
 13
13 -
 14
14 -
 15
15 -
 16
16 -
 17
17 -
 18
18 -
 19
19 -
 20
20 -
 21
21 -
 22
22 -
23
-
24
-
25
-
26
-
27
-
28
-
29
-
30
-
31
-
32
-
33
-
34
-
35
-
36
-
37
-
38
-
39
-
40
-
41
-
42
-
43
-
44
-
45
-
46
-
47
-
48
-
49
-
50
-
51
-
52
-
53
-
54
-
55
-
56
-
57
-
58
-
59
-
60
-
61
-
62
-
63
-
64
-
65
-
66
-
67
-
68
-
69
-
70
-
71
-
72
-
73
-
74
-
75
-
76
-
77
-
78
-
79
-
80
-
81
-
82
-
83
-
84
-
85
-
86
-
87
-
88
-
89
-
90
-
91
-
92
-
93
-
94
-
95
-
96
-
97
-
98
-
99
-
100
-
101
-
102
-
103
-
104
-
105
-
106
-
107
-
108
-
109
-
110
-
111
-
112
-
113
-
114
-
115
-
116
-
117
-
118
-
119
-
120
-
121
-
122
-
123
-
124
-
125
-
126
-
127
-
128
 |
 |

Approximately 20 percent of Sunoco’s crude oil supply (excluding the amount pertaining to the Tulsa
refinery) during 2009 came from Nigeria. Some of the crude oil producing areas of this West African country
have experienced political and ethnic violence as well as labor disruptions in recent years, which has resulted in
the shutdown of a small portion of total Nigerian crude oil production during that time. The lost crude oil
production in Nigeria did not have a material impact on Sunoco’s operations. From time to time, Sunoco has
used other sweet crude oil alternatives in addition to the Nigerian grades. The Company believes these other
sources of light-sweet crude oil will continue to be available in the event it elects to continue to diversify its
crude oil slate for economic reasons or in the event it is unable to obtain crude oil from Nigeria in the future.
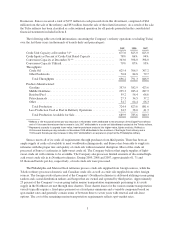
The following table sets forth information concerning the source of the Company’s crude oil purchases for
its Marcus Hook, Philadelphia, Eagle Point and Toledo refineries (in thousands of barrels daily):
2009 2008 2007
Crude Oil Source:
West Africa ................................................ 365.5 434.6 530.2
Domestic ................................................... 53.3 62.1 58.3
Canada .................................................... 71.7 75.0 89.7
Central Asia ................................................ 85.9 71.8 37.3
North Sea .................................................. 31.7 7.6 7.5
South and Central America .................................... 12.5 31.8 35.8
Australia ................................................... — 5.4 —
“Lubes-Extracted” Gasoil/Naphtha Intermediate Feedstock ........... 8.4 12.8 10.1
629.0 701.1 768.9
Refining and Supply sells fuels through wholesale and industrial channels principally in the Northeast and
upper Midwest and sells petrochemicals on a worldwide basis. The following table sets forth Refining and
Supply’s refined product sales (excluding those from the Tulsa refinery) (in thousands of barrels daily):
2009 2008 2007
To Unaffiliated Customers:
Gasoline ................................................... 147.6 186.4 181.5
Middle Distillates ............................................ 223.5 269.2 287.8
Residual Fuel ............................................... 69.5 65.4 75.9
Petrochemicals .............................................. 7.3 12.5 15.4
Other ...................................................... 24.2 31.3 31.4
472.1 564.8 592.0
To Affiliates* ................................................. 341.8 348.5 361.8
813.9 913.3 953.8
*Includes gasoline and middle distillate sales to Retail Marketing and benzene, cumene and propylene sales to Chemicals.
Feedstocks can be moved between Refining and Supply’s refineries in the Northeast by barge, truck and
rail. In addition, an interrefinery pipeline leased from Sunoco Logistics Partners L.P. enables the transfer of
unfinished stocks, including butanes, naphtha, distillate blendstocks and gasoline blendstocks between the
Philadelphia and Marcus Hook refineries. Finished products are delivered to customers via the pipeline and
terminal network owned and operated by Sunoco Logistics Partners L.P. (see “Logistics” below) as well as by
third-party pipelines and barges and by truck and rail.
During the 2008-2009 period, Refining and Supply had capital outlays of approximately $370 million to
essentially complete projects at its Philadelphia and Toledo refineries under a 2005 Consent Decree, which
4