Sunoco 2009 Annual Report Download - page 11
Download and view the complete annual report
Please find page 11 of the 2009 Sunoco annual report below. You can navigate through the pages in the report by either clicking on the pages listed below, or by using the keyword search tool below to find specific information within the annual report.-
 1
1 -
 2
2 -
 3
3 -
 4
4 -
 5
5 -
 6
6 -
 7
7 -
 8
8 -
 9
9 -
 10
10 -
 11
11 -
 12
12 -
 13
13 -
 14
14 -
 15
15 -
 16
16 -
 17
17 -
 18
18 -
 19
19 -
 20
20 -
 21
21 -
 22
22 -
23
-
24
-
25
-
26
-
27
-
28
-
29
-
30
-
31
-
32
-
33
-
34
-
35
-
36
-
37
-
38
-
39
-
40
-
41
-
42
-
43
-
44
-
45
-
46
-
47
-
48
-
49
-
50
-
51
-
52
-
53
-
54
-
55
-
56
-
57
-
58
-
59
-
60
-
61
-
62
-
63
-
64
-
65
-
66
-
67
-
68
-
69
-
70
-
71
-
72
-
73
-
74
-
75
-
76
-
77
-
78
-
79
-
80
-
81
-
82
-
83
-
84
-
85
-
86
-
87
-
88
-
89
-
90
-
91
-
92
-
93
-
94
-
95
-
96
-
97
-
98
-
99
-
100
-
101
-
102
-
103
-
104
-
105
-
106
-
107
-
108
-
109
-
110
-
111
-
112
-
113
-
114
-
115
-
116
-
117
-
118
-
119
-
120
-
121
-
122
-
123
-
124
-
125
-
126
-
127
-
128
 |
 |

Businesses. Sunoco received a total of $157 million in cash proceeds from this divestment, comprised of $64
million from the sale of the refinery and $93 million from the sale of the related inventory. As a result of the sale,
the Tulsa refinery has been classified as a discontinued operation for all periods presented in the consolidated
financial statements included in Item 8.
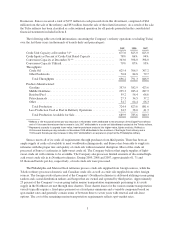
The following table sets forth information concerning the Company’s refinery operations (excluding Tulsa)
over the last three years (in thousands of barrels daily and percentages):
2009 2008 2007
Crude Unit Capacity at December 31* ............................ 675.0 825.0 825.0
Crude Inputs as Percent of Crude Unit Rated Capacity ................ 78% 86% 94%
Conversion Capacity at December 31** ........................... 343.0 398.0 398.0
Conversion Capacity Utilized ................................... 79% 87% 95%
Throughputs:
Crude Oil ................................................. 625.4 706.5 767.2
Other Feedstocks ........................................... 70.8 84.8 79.7
Total Throughputs ........................................ 696.2 791.3 846.9
Products Manufactured:
Gasoline .................................................. 357.9 382.9 423.6
Middle Distillates ........................................... 225.3 285.4 287.9
Residual Fuel .............................................. 59.2 56.4 66.6
Petrochemicals ............................................. 27.3 34.5 37.2
Other ..................................................... 54.7 64.4 66.3
Total Production .......................................... 724.4 823.6 881.6
Less Production Used as Fuel in Refinery Operations ............... 34.5 38.0 41.3
Total Production Available for Sale ........................... 689.9 785.6 840.3
*Reflects a 150 thousand barrels-per-day reduction in November 2009 attributable to the shutdown of the Eagle Point refinery
and a 10 thousand barrels-per-day increase in July 2007 attributable to a crude unit debottleneck project at the Toledo refinery.
**Represents capacity to upgrade lower-value, heavier petroleum products into higher-value, lighter products. Reflects a
55 thousand barrels-per-day reduction in November 2009 attributable to the shutdown of the Eagle Point refinery and a
15 thousand barrels-per-day increase in May 2007 attributable to an expansion project at the Philadelphia refinery.
Sunoco meets all of its crude oil requirements through purchases from third parties. There has been an
ample supply of crude oil available to meet worldwide refining needs, and Sunoco has been able to supply its
refineries with the proper mix and quality of crude oils without material disruption. Most of the crude oil
processed at Sunoco’s refineries is light-sweet crude oil. The Company believes that ample supplies of light-
sweet crude oil will continue to be available. The Company also processes limited amounts of discounted high-
acid sweet crude oils in its Northeast refineries. During 2009, 2008 and 2007, approximately 61, 71 and
62 thousand barrels per day, respectively, of such crude oils were processed.
The Philadelphia and Marcus Hook refineries process crude oils supplied from foreign sources, while the
Toledo refinery processes domestic and Canadian crude oils as well as crude oils supplied from other foreign
sources. The foreign crude oil processed at the Company’s Northeast refineries is delivered utilizing ocean-going
tankers and coastal distribution tankers and barges that are owned and operated by third parties. Approximately
25 percent of the Company’s ocean-going tanker marine transportation requirements pertaining to its crude
supply in the Northeast are met through time charters. Time charter leases for the various marine transportation
vessels typically require a fixed-price payment or a fixed-price minimum and a variable component based on
spot-market rates and generally contain terms of between three to seven years with renewal and sub-lease
options. The cost of the remaining marine transportation requirements reflects spot-market rates.
3