Sunoco 2006 Annual Report Download - page 12
Download and view the complete annual report
Please find page 12 of the 2006 Sunoco annual report below. You can navigate through the pages in the report by either clicking on the pages listed below, or by using the keyword search tool below to find specific information within the annual report.-
 1
1 -
 2
2 -
 3
3 -
 4
4 -
 5
5 -
 6
6 -
 7
7 -
 8
8 -
 9
9 -
 10
10 -
 11
11 -
 12
12 -
 13
13 -
 14
14 -
 15
15 -
 16
16 -
 17
17 -
 18
18 -
 19
19 -
 20
20 -
 21
21 -
 22
22 -
23
-
24
-
25
-
26
-
27
-
28
-
29
-
30
-
31
-
32
-
33
-
34
-
35
-
36
-
37
-
38
-
39
-
40
-
41
-
42
-
43
-
44
-
45
-
46
-
47
-
48
-
49
-
50
-
51
-
52
-
53
-
54
-
55
-
56
-
57
-
58
-
59
-
60
-
61
-
62
-
63
-
64
-
65
-
66
-
67
-
68
-
69
-
70
-
71
-
72
-
73
-
74
-
75
-
76
-
77
-
78
-
79
-
80
-
81
-
82
 |
 |

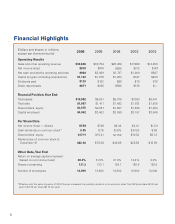
Results of Operations
Earnings Profile of Sunoco Businesses (after tax)
(Millions of Dollars) 2006 2005 2004
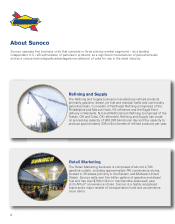
Refining and Supply $881 $947 $541
Retail Marketing 76 30 68
Chemicals 43 94 94
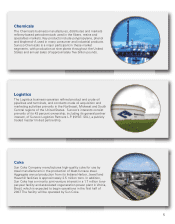
Logistics 36 22 31
Coke 50 48 40
Corporate and Other:
Corporate expenses (58) (84) (67)
Net financing expenses and other (49) (45) (78)
Income tax matters —18 18
Phenol supply contract dispute —(56) —
Asset write-downs and other matters —— (8)
Debt restructuring —— (34)
Consolidated net income $979 $974 $605
Analysis of Earnings Profile of Sunoco Businesses
In 2006, Sunoco earned $979 million, or $7.59 per share of common stock on a diluted
basis, compared to $974 million, or $7.08 per share, in 2005 and $605 million, or $4.04 per
share, in 2004.
The $5 million increase in net income in 2006 was primarily due to higher margins in
Sunoco’s Refining and Supply ($73 million) and Retail Marketing ($50 million) busi-
nesses, a benefit attributable to LIFO inventory profits in Sunoco’s Refining and Supply
business ($16 million) and the absence of a loss associated with a phenol supply contract
dispute ($56 million). Partially offsetting these positive factors were higher expenses ($75
million), including fuel charges and refinery operating expenses; lower margins from Suno-
co’s Chemicals business ($67 million); and lower production of refined products ($48
million).
In 2005, the $369 million increase in net income was primarily due to higher margins in
Sunoco’s Refining and Supply business ($467 million). Also contributing to the improve-
ment in earnings were higher margins from Sunoco’s Chemicals business ($34 million);
higher production of refined products ($41 million); the absence of a loss on early ex-
tinguishment of debt in connection with a debt restructuring in 2004 ($34 million); and
lower net financing expenses ($33 million). Partially offsetting these positive factors were
higher expenses ($124 million), primarily fuel and employee-related charges; a loss asso-
ciated with a phenol supply contract dispute ($56 million); lower margins in Sunoco’s Re-
tail Marketing business ($52 million); and lower chemical sales volumes ($13 million).
Refining and Supply
The Refining and Supply business manufactures petroleum products and commodity pet-
rochemicals at its Marcus Hook, Philadelphia, Eagle Point and Toledo refineries and petro-
leum and lubricant products at its Tulsa refinery and sells these products to other Sunoco
businesses and to wholesale and industrial customers. Refining operations are comprised of
10