Sunoco 2005 Annual Report Download - page 3
Download and view the complete annual report
Please find page 3 of the 2005 Sunoco annual report below. You can navigate through the pages in the report by either clicking on the pages listed below, or by using the keyword search tool below to find specific information within the annual report.-
 1
1 -
 2
2 -
 3
3 -
 4
4 -
 5
5 -
 6
6 -
 7
7 -
 8
8 -
 9
9 -
 10
10 -
 11
11 -
 12
12 -
 13
13 -
 14
14 -
15
-
16
-
17
-
18
-
19
-
20
-
21
-
22
-
23
-
24
-
25
-
26
-
27
-
28
-
29
-
30
-
31
-
32
-
33
-
34
-
35
-
36
-
37
-
38
-
39
-
40
-
41
-
42
-
43
-
44
-
45
-
46
-
47
-
48
-
49
-
50
-
51
-
52
-
53
-
54
-
55
-
56
-
57
-
58
-
59
-
60
-
61
-
62
-
63
-
64
-
65
-
66
-
67
-
68
-
69
-
70
-
71
-
72
-
73
-
74
-
75
-
76
-
77
-
78
 |
 |

1
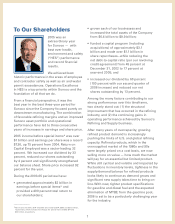
To Our Shareholders
2005 was an
extraordinary year
for Sunoco — with
best ever health,
environment and safety
(“HES”) performance
and record fi nancial
results.
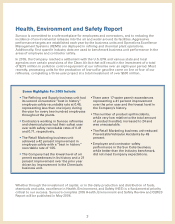
We achieved best
historic performance in the areas of employee
and contractor safety as well as air and water
permit exceedences. Operations Excellence
in HES is a top priority within Sunoco and the
foundation of all that we do.
From a fi nancial perspective, it was the
best year in the best three-year period for
Sunoco since the Company focused purely on
downstream manufacturing. The combination
of favorable refi ning margins and an improved
Sunoco asset portfolio and operational
performance have led to three consecutive
years of increases in earnings and share price.
2005 income before special items* was over
$1 billion and earnings per share was a record
$7.36, up 75 percent from 2004. Return on
Capital Employed was a sector-leading 32
percent. We increased our dividend by 33
percent, reduced our shares outstanding
by 4 percent and signifi cantly strengthened
our balance sheet. Share price increased 92
percent for the year.
During the 2003-05 period we have:
• generated approximately $2 billion in
earnings before special items* and
provided a 400 percent total return to
our shareholders;
__________
*Net income for 2005, 2004 and 2003 amounted to $974, $605 and $312 million,
respectively, which includes net charges for special items of $38, $24 and
$23 million, respectively.
• grown each of our businesses and
increased the total assets of the Company
from $6.4 billion to $9.9 billion;
• funded a capital program (including
acquisitions) of approximately $3.1
billion and made over $1.1 billion in
share repurchases...while reducing the
net debt-to-capital ratio (per our revolving
credit agreement) from 45 percent at
December 31, 2002 to 17 percent at
year-end 2005; and
• increased our dividend by 60 percent
(100 percent with our second quarter of
2006 increase) and reduced our net
shares outstanding by 13 percent.
Among the many factors contributing to our
strong performance over this timeframe,
two clearly stand out: (1) the structural
improvement that has occurred in the refi ning
industry, and (2) the continuing gains in
operating performance achieved by Sunoco’s
Refi ning and Supply business.
After many years of overcapacity, growing
refi ned product demand is increasingly
pushing the limits of U.S. and global refi ning
capacity. Refi ned products, which in the
oversupplied market of the 1980s and 90s
were largely priced on a cost basis, are now
selling more on value — how much the market
will pay for an essential but limited product.
While still cyclical and volatile and impacted by
fl uctuations in inventory levels, tightness in the
supply/demand balance for refi ned products
looks likely to continue as demand grows and
signifi cant new supply takes time to bring on-
line. With new, tighter product specifi cations
for gasoline and diesel fuel and the expected
elimination of MTBE from the gasoline pool,
2006 is set to be a particularly challenging year
for the industry.