Sunoco 2004 Annual Report Download - page 10
Download and view the complete annual report
Please find page 10 of the 2004 Sunoco annual report below. You can navigate through the pages in the report by either clicking on the pages listed below, or by using the keyword search tool below to find specific information within the annual report.-
 1
1 -
 2
2 -
 3
3 -
 4
4 -
 5
5 -
 6
6 -
 7
7 -
 8
8 -
 9
9 -
 10
10 -
 11
11 -
 12
12 -
 13
13 -
 14
14 -
 15
15 -
 16
16 -
 17
17 -
 18
18 -
 19
19 -
 20
20 -
 21
21 -
22
-
23
-
24
-
25
-
26
-
27
-
28
-
29
-
30
-
31
-
32
-
33
-
34
-
35
-
36
-
37
-
38
-
39
-
40
-
41
-
42
-
43
-
44
-
45
-
46
-
47
-
48
-
49
-
50
-
51
-
52
-
53
-
54
-
55
-
56
-
57
-
58
-
59
-
60
-
61
-
62
-
63
-
64
-
65
-
66
-
67
-
68
-
69
-
70
-
71
-
72
-
73
-
74
-
75
-
76
-
77
-
78
-
79
-
80
 |
 |

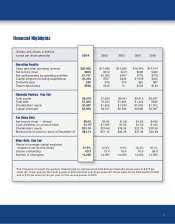
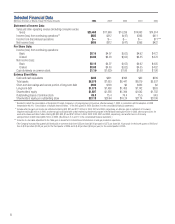
Selected Financial Data
(Millions of Dollars or Shares, Except Per Share Amounts) 2004 2003* 2002 2001 2000
Statement of Income Data:
Sales and other operating revenue (including consumer excise
taxes) $25,468 $17,969 $14,299 $14,063 $14,514
Income (loss) from continuing operations** $605 $312 $(47) $398 $411
Income from discontinued operations $— $— $— $— $11***
Net income (loss) $605 $312 $(47) $398 $422
Per Share Data:
Income (loss) from continuing operations:
Basic $8.16 $4.07 $(.62) $4.92 $4.72
Diluted $8.08 $4.03 $(.62) $4.85 $4.70
Net income (loss):
Basic $8.16 $4.07 $(.62) $4.92 $4.85
Diluted $8.08 $4.03 $(.62) $4.85 $4.82
Cash dividends on common stock $1.15†$1.025†$1.00 $1.00 $1.00
Balance Sheet Data:
Cash and cash equivalents $405 $431 $390 $42 $239
Total assets $8,079 $7,053 $6,441 $6,019 $5,537
Short-term borrowings and current portion of long-term debt $103 $103 $2 $302 $2
Long-term debt $1,379 $1,498 $1,453 $1,142 $933
Shareholders’ equity $1,607 $1,556 $1,394 $1,642 $1,702
Outstanding shares of common stock 69.3 75.4 76.4 75.5 84.8
Shareholders’ equity per outstanding share $23.18 $20.64 $18.24 $21.74 $20.06
* Restated to reflect the consolidation of the Epsilon Products Company, LLC polypropylene joint venture, effective January 1, 2003, in connection with the adoption of FASB
Interpretation No. 46, “Consolidation of Variable Interest Entities,” in the first quarter of 2004. (See Note 1 to the consolidated financial statements.)
** Includes after-tax gains on income tax settlements totaling $18, $21 and $117 million in 2004, 2001 and 2000, respectively, an after-tax gain on settlement of insurance
litigation totaling $5 million in 2000, an after-tax gain associated with a retail marketing divestment program in the Midwest totaling $9 million in 2003, after-tax provisions for
asset write-downs and other matters totaling $8, $32, $22, $1 and $147 million in 2004, 2003, 2002, 2001 and 2000, respectively, and an after-tax loss from early
extinguishment of debt totaling $34 million in 2004. (See Notes 2, 3, 4 and 11 to the consolidated financial statements.)
*** Consists of a favorable adjustment to the 1996 gain on divestment of discontinued international oil and gas production operations.
†The Company increased the quarterly dividend paid on common stock from $.25 per share ($1.00 per year) to $.275 per share ($1.10 per year) for the fourth quarter of 2003 and
then to $.30 per share ($1.20 per year) for the third quarter of 2004 and to $.40 per share ($1.60 per year) for the second quarter of 2005.
8