Ryanair 2011 Annual Report Download - page 12
Download and view the complete annual report
Please find page 12 of the 2011 Ryanair annual report below. You can navigate through the pages in the report by either clicking on the pages listed below, or by using the keyword search tool below to find specific information within the annual report.-
 1
1 -
 2
2 -
 3
3 -
 4
4 -
 5
5 -
 6
6 -
 7
7 -
 8
8 -
 9
9 -
 10
10 -
 11
11 -
 12
12 -
 13
13 -
 14
14 -
 15
15 -
 16
16 -
 17
17 -
 18
18 -
 19
19 -
 20
20 -
 21
21 -
 22
22 -
23
-
24
-
25
-
26
-
27
-
28
-
29
-
30
-
31
-
32
-
33
-
34
-
35
-
36
-
37
-
38
-
39
-
40
-
41
-
42
-
43
-
44
-
45
-
46
-
47
-
48
-
49
-
50
-
51
-
52
-
53
-
54
-
55
-
56
-
57
-
58
-
59
-
60
-
61
-
62
-
63
-
64
-
65
-
66
-
67
-
68
-
69
-
70
-
71
-
72
-
73
-
74
-
75
-
76
-
77
-
78
-
79
-
80
-
81
-
82
-
83
-
84
-
85
-
86
-
87
-
88
-
89
-
90
-
91
-
92
-
93
-
94
-
95
-
96
-
97
-
98
-
99
-
100
-
101
-
102
-
103
-
104
-
105
-
106
-
107
-
108
-
109
-
110
-
111
-
112
-
113
-
114
-
115
-
116
-
117
-
118
-
119
-
120
-
121
-
122
-
123
-
124
-
125
-
126
-
127
-
128
-
129
-
130
-
131
-
132
-
133
-
134
-
135
-
136
-
137
-
138
-
139
-
140
-
141
-
142
-
143
-
144
-
145
-
146
-
147
-
148
-
149
-
150
-
151
-
152
-
153
-
154
-
155
-
156
-
157
-
158
-
159
-
160
-
161
-
162
-
163
-
164
-
165
-
166
-
167
-
168
-
169
-
170
-
171
-
172
-
173
-
174
-
175
-
176
-
177
-
178
-
179
-
180
-
181
-
182
-
183
-
184
-
185
-
186
-
187
-
188
-
189
-
190
-
191
-
192
-
193
-
194
 |
 |

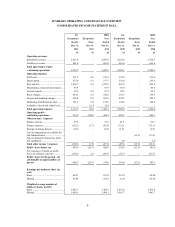
10
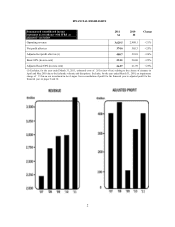
Reconciliation of profit for the year under IFRS to adjusted profit for the financial year
Year ended
March 31,
2011
Year ended
March 31,
2010
1M 1M
Profit for the financial year – IFRS
374.6
305.3
Adjustments
Icelandic volcanic ash related cost ......................................................
26.1
-
Loss on impairment of available for sale financial asset ....................
-
13.5
Adjusted profit for the financial year 400.7
318.8
Exceptional items
The Company presents certain items separately, which are unusual, by virtue of their size and incidence,
in the context of our ongoing core operations, as we believe this presentation represents the underlying
business more accurately and reflects the manner in which investors typically analyse the results. Any
amounts deemed “exceptional” for management discussion and analysis purposes, in the Chairman’s Report
and Chief Executive’s Report, have been classified for the purposes of the income statement in the same way
as non-exceptional amounts of the same nature.
Exceptional items in the year ended March 31, 2011 amounted to 126.1m reflecting the estimated costs
relating to the closure of airspace in April and May 2010 due to the Icelandic volcanic ash disruptions. The
closure of European airspace in April and May 2010, due to the Icelandic volcanic ash disruption, resulted in
the cancellation of 9,400 Ryanair flights. The impact on the Group’s operating results totaled 129.7m (pre tax)
for the year ended March 31, 2011, comprising 115.6m of operating expenses and 11.7m of finance expenses
attributable to the period of flight disruption, together with estimated passenger compensation costs of 112.4m
pursuant to Regulation (EC) No. 261/2004 (‘EU261’). The Company’s estimate of total passenger
compensation costs has been determined based on actual claims received and processed to date together with
probable future compensation payments and other related costs.
Exceptional items in the year ended March 31, 2010 amounted to 113.5m reflecting an impairment of the
Aer Lingus shareholding.
Adjusted profit after tax excluding exceptional items increased by 26% to 1400.7m. Including
exceptional items the profit after tax for the year increased by 23% to 1374.6m compared to a profit of
1305.3m in the year ended March 31, 2010.
Summary year ended March 31, 2011
Adjusted profit after tax increased by 26% to 1400.7m compared to 1318.8m in the year ended March
31, 2010 primarily due to a 12% increase in average fares and strong ancillary revenues, offset by a 37%
increase in fuel costs. Total operating revenues increased by 21% to 13,629.5m as average fares rose by
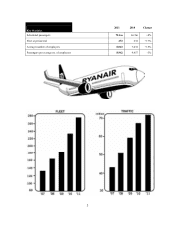
12%. Ancillary revenues grew by 21%, faster than the 8% increase in passenger numbers, to 1801.6m due to
an improved product mix and higher internet related revenues. Total revenue per passenger, as a result,
increased by 12%, whilst Load Factor was up 1% to 83% during the year.
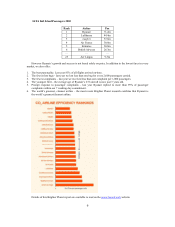
Total operating expenses increased by 20% to 13,113.3m, primarily due to an increase in fuel prices,
the higher level of activity, and the higher operating costs associated with the growth of the airline. Fuel,
which represents 39% of total operating costs compared to 35% in the prior year, increased by 37% to
11,226.7m due to the higher price per gallon paid and a 17% increase in the number of hours flown. Unit
costs excluding fuel increased by 3% and including fuel they rose by 11%. Operating margin rose by 1% to
14% whilst operating profit increased by 28% to 1516.2m.
Adjusted net margin was 11%, similar to the prior year.
Adjusted earnings per share for the year were 26.97 euro cent compared to 21.59 euro cent for the
prior year.