Ryanair 2006 Annual Report Download - page 10
Download and view the complete annual report
Please find page 10 of the 2006 Ryanair annual report below. You can navigate through the pages in the report by either clicking on the pages listed below, or by using the keyword search tool below to find specific information within the annual report.-
 1
1 -
 2
2 -
 3
3 -
 4
4 -
 5
5 -
 6
6 -
 7
7 -
 8
8 -
 9
9 -
 10
10 -
 11
11 -
 12
12 -
 13
13 -
 14
14 -
 15
15 -
 16
16 -
 17
17 -
 18
18 -
 19
19 -
 20
20 -
 21
21 -
22
-
23
-
24
-
25
-
26
-
27
-
28
-
29
-
30
-
31
-
32
-
33
-
34
-
35
-
36
-
37
-
38
-
39
-
40
-
41
-
42
-
43
-
44
-
45
-
46
-
47
-
48
-
49
-
50
-
51
-
52
-
53
-
54
-
55
-
56
-
57
-
58
-
59
-
60
-
61
-
62
-
63
-
64
-
65
-
66
-
67
-
68
-
69
-
70
-
71
-
72
-
73
-
74
-
75
-
76
 |
 |

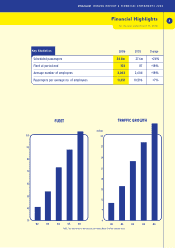
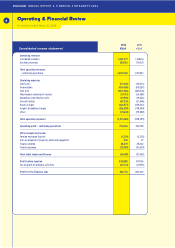
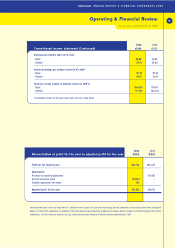
Profit after tax for the year increased by 10% to 306.7m compared to 280.1m
in the previous year, whilst adjusted profit after tax increased by 12% to 301.5m.
For the purpose of the Operating and Financial Review all figures and comments
are by reference to the adjusted income statement which excludes certain items
as detailed on page 9.
for the year ended March 31, 2006
Operating & Financial Review
10
ANNUAL REPORT & FINANCIAL STATEMENTS 2006
Adjusted Profit for the Year
Profit after tax increased by 12% to 301.5m, compared to
268.1m in the previous year ended March 31, 2005. Total
operating revenues increased by 28% to 1,692.5m, which was
faster than the 26% growth in passenger volumes, as average
fares rose by 1% and ancillary revenues grew by 36% to
259.2m. Total revenue per passenger as a result increased by
2%, whilst passenger load factor decreased by 1 point to 83%.
Operating Revenues
Total operating revenues increased by 28% to 1,692.5m whilst
passenger volumes increased by 26% to 34.8m. Total revenue
per passenger increased by 2% in the year due to a combination
of slightly higher average fares and strong ancillary revenue
growth.
Scheduled passenger revenuesincreased by 27% to
1,433.4m due to a combination of increased passenger
volumes on existing routes, the successful launch of new bases
at Liverpool, Shannon, East Midlands, Pisa and Cork and a 1%
increase in average fares.
Ancillary revenues increased by 36% to 259.2m, a faster
growth rate than passenger volumes, reflecting a strong
performance in non-flight scheduled revenues (primarily car hire,
hotels and travel insurance), on board sales and other ancillary
products. Ancillary revenues continue to grow at a significantly
faster rate than passenger volumes.
Adjusted Operating Expenses
Total adjusted operating expenses increased by 34% to
1,323.4m due to the increased level of activity, and the
increased costs primarily fuel, aircraft rentals, route charges,
staff costs and airport & handling costs associated with the
growth of the airline. Total operating costs were also adversely
impacted by the increase in the average sector length whilst
higher US$ fuel prices were partially offset by the strength of
the Euro exchange rate against the US$.
Staff costs have increased by 21% to 171.4m primarily due to
an 18% increase in average employee numbers to 3,063 and the
impact of pay increases granted of 3%.
Depreciation and amortisation increased by 13% to 124.4m.
A higher depreciation charge due to an increase in the size of
the ‘owned’ fleet from 74 to 86, was offset by a lower
amortisation charge due to the retirement of the Boeing 737-
200 aircraft and the positive impact of a new engine
maintenance deal on the cost of aircraft amortisation. The
strengthening of the Euro to the US$ during the year has also
had a positive impact on the depreciation and amortisation
charge on new aircraft deliveries.
Fuel costs rose by 74% to 462.5m due to an increase in the
number of sectors flown, an 8% increase in sector length, and a
significantly higher average US$ cost per gallon of fuel partially
offset by the positive impact of the strengthening of the Euro to
the US$ during the year.
Maintenance costs excluding a release of 5.2m in year ending
March 31, 2005 associated with the earlier than scheduled
return of 6 leased Boeing 737-300’s, increased by 19%,
reflecting the retirement of the Boeing 737-200’s, and the
positive impact of the strengthening of the Euro exchange rate,
partially offset by an increase in the number of leased Boeing
737-800 aircraft from 13 to 17.
Marketing and distribution costs decreased by 29% to 13.9m
due to reduction in the level of marketing activity and related
expenditure compared to the previous year.
Aircraft rentals increased by 42% to 47.4m reflecting an
additional 4 aircraft on lease during the year. An additional
5.5m incurred on short term leases during the 4th quarter was
offset by the savings arising from the return of 6 Boeing 737-300
aircraft to ILFC.
Route charges increased by 21% to 164.6m due to an increase
in the number of sectors flown and an increase of 8% in the
average sector length, offset by a reduction in enroute charges
in certain EU countries.