Rayovac 2014 Annual Report Download - page 4
Download and view the complete annual report
Please find page 4 of the 2014 Rayovac annual report below. You can navigate through the pages in the report by either clicking on the pages listed below, or by using the keyword search tool below to find specific information within the annual report.-
 1
1 -
 2
2 -
 3
3 -
 4
4 -
 5
5 -
 6
6 -
 7
7 -
 8
8 -
 9
9 -
 10
10 -
 11
11 -
 12
12 -
 13
13 -
 14
14 -
 15
15 -
16
-
17
-
18
-
19
-
20
-
21
-
22
-
23
-
24
-
25
-
26
-
27
-
28
-
29
-
30
-
31
-
32
-
33
-
34
-
35
-
36
-
37
-
38
-
39
-
40
-
41
-
42
-
43
-
44
-
45
-
46
-
47
-
48
-
49
-
50
-
51
-
52
-
53
-
54
-
55
-
56
-
57
-
58
-
59
-
60
-
61
-
62
-
63
-
64
-
65
-
66
-
67
-
68
-
69
-
70
-
71
-
72
-
73
-
74
-
75
-
76
-
77
-
78
-
79
-
80
-
81
-
82
-
83
-
84
-
85
-
86
-
87
-
88
-
89
-
90
-
91
-
92
-
93
-
94
-
95
-
96
-
97
-
98
-
99
-
100
-
101
-
102
-
103
-
104
-
105
-
106
-
107
-
108
-
109
-
110
-
111
-
112
-
113
-
114
-
115
-
116
-
117
-
118
-
119
-
120
-
121
-
122
-
123
-
124
-
125
-
126
-
127
-
128
-
129
-
130
-
131
-
132
-
133
-
134
-
135
-
136
-
137
-
138
-
139
-
140
-
141
-
142
-
143
-
144
-
145
-
146
-
147
-
148
 |
 |

David R. Lumley
Chief Executive Officer
Douglas L. Martin
Executive Vice President and
Chief Financial Officer
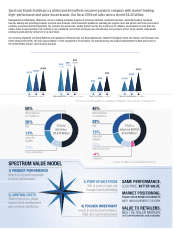
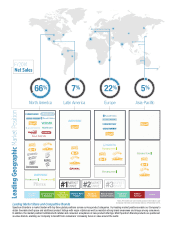
Spectrum Brands reported a fi fth consecutive year of record performance
in fi scal 2014 with results meeting or exceeding our fi nancial targets.
Our reported sales increased 8.4 percent in fi scal 2014 and, including
our HHI business for all of fi scal 2013 on a pro forma basis, sales grew
3.5 percent – and consistently at that rate in all four quarters. Adjusted
EBITDA growth of 7 percent was twice the rate of our sales increase.
Gross and adjusted EBITDA margins both expanded, the latter to 16.4
percent from 15.8 percent, which includes HHI for all of fi scal 2013 on
a pro forma basis. This was our seventh consecutive year of adjusted
EBITDA margin expansion and a 340 basis point improvement since fi scal
2009. Free cash fl ow increased to a record $359 million, or nearly $7
per share, up from $254 million and $208 million in the past two years.
Term debt was reduced by approximately $250 million, resulting in lower
total leverage of about 4.1 times at the end of fi scal 2014. Continuous
improvement savings reached a record annual amount for the fourth
straight year.
We plan for a sixth consecutive year of record performance in fi scal 2015
despite some new and signifi cant pressures. Our Company continues
to execute well and, as in recent years, overcome such challenges as
sluggish spending by cautious consumers, tighter retailer inventory
levels, stagnant store traffi c, and increased competitor discounting in
some of our businesses. This is a testament to the resilience of our
businesses and our brand strength and diversity, and a clear recognition
that value is winning in the marketplace.
How are we able to do this? Our strategy for consistently better
performance year after year remains the same. We focus on driving
high cash-generating consumer products businesses by maximizing
our Spectrum Value Model, global new product development and
shared services infrastructures to minimize operating costs, increase
distribution/shelf space at key retailers, add new retail customers,
expand e-commerce, leverage cross-selling opportunities, and
grow our international footprint. We maintain a strong continuous
improvement culture and a lean and effi cient operating structure to
ensure a nimbleness to move quickly and decisively to counteract
market changes and challenges.
We deploy a powerful weapon in our strategic arsenal – a Spectrum
Value Model that connects strongly with retailers and consumers. Our
“Same or Better Performance/Less Price”, value-branded and largely
non-discretionary replacement products are an ideal match for smart,
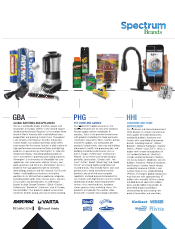
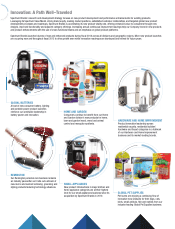
value-focused shoppers. Buoyed by a stream of innovative products
launching globally in all segments (some of which are highlighted
in this report), our Spectrum Value Model enables us to continue to
take market share despite competitor price discounting. Our
Spectrum Value Model redefi nes the value proposition
for retailers and consumers. It provides higher
margins and lower acquisition costs to our
retail customers, with retail category growth,
market share gains, and excellent category
management and merchandising. We
concentrate on winning at point of sale
and not through brand advertising.
This allows us to invest in product
performance, R&D and cost
improvement. This is our model
and it is working.
With record fiscal 2014 results and solid prospects for improvement again in fiscal 2015, Spectrum Brands remains a company
on the move, with momentum to build an even stronger platform for sustained global growth and increased shareholder value
creation by following our plan, staying in formation and executing our strategy.
TO OUR
SHAREHOLDERS