Quest Diagnostics 2014 Annual Report Download - page 71
Download and view the complete annual report
Please find page 71 of the 2014 Quest Diagnostics annual report below. You can navigate through the pages in the report by either clicking on the pages listed below, or by using the keyword search tool below to find specific information within the annual report.-
 1
1 -
2
-
3
-
4
-
5
-
6
-
7
-
8
-
9
-
10
-
11
-
12
-
13
-
14
-
15
-
16
-
17
-
18
-
19
-
20
-
21
-
22
-
23
-
24
-
25
-
26
-
27
-
28
-
29
-
30
-
31
-
32
-
33
-
34
-
35
-
36
-
37
-
38
-
39
-
40
-
41
-
42
-
43
-
44
-
45
-
46
-
47
-
48
-
49
-
50
-
51
-
52
-
53
-
54
-
55
-
56
-
57
-
58
-
59
-
60
-
 61
61 -
 62
62 -
 63
63 -
 64
64 -
 65
65 -
 66
66 -
 67
67 -
 68
68 -
 69
69 -
 70
70 -
 71
71 -
 72
72 -
 73
73 -
 74
74 -
 75
75 -
 76
76 -
 77
77 -
 78
78 -
 79
79 -
 80
80 -
 81
81 -
82
-
83
-
84
-
85
-
86
-
87
-
88
-
89
-
90
-
91
-
92
-
93
-
94
-
95
-
96
-
97
-
98
-
99
-
100
-
101
-
102
-
103
-
104
-
105
-
106
-
107
-
108
-
109
-
110
-
111
-
112
-
113
-
114
-
115
-
116
-
117
-
118
-
119
-
120
-
121
 |
 |

)
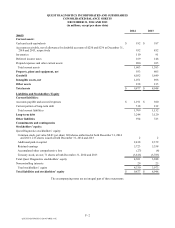
QUEST DIAGNOSTICS INCORPORATED AND SUBSIDIARIES
CONSOLIDATED STATEMENTS OF OPERATIONS
FOR THE YEARS ENDED DECEMBER 31, 2014, 2013 AND 2012
(in millions, except per share data)
2014 2013 2012
Net revenues
Operating costs and expenses:
&RVWRIVHUYLFHV
6HOOLQJJHQHUDODQGDGPLQLVWUDWLYH
$PRUWL]DWLRQRILQWDQJLEOHDVVHWV
*DLQRQVDOHRIUR\DOW\ULJKWV ² ²
2WKHURSHUDWLQJLQFRPHH[SHQVHQHW
7RWDORSHUDWLQJFRVWVDQGH[SHQVHV
Operating income
Other income (expense):
,QWHUHVWH[SHQVHQHW
(TXLW\LQHDUQLQJVRIHTXLW\PHWKRGLQYHVWHHV
2WKHULQFRPHQHW
7RWDOQRQRSHUDWLQJH[SHQVHVQHW
Income from continuing operations before taxes
Income tax expense
Income from continuing operations
Income (loss) from discontinued operations, net of taxes
Net income
Less: Net income attributable to noncontrolling interests
Net income attributable to Quest Diagnostics
Amounts attributable to Quest Diagnostics’ stockholders:
,QFRPHIURPFRQWLQXLQJRSHUDWLRQV
,QFRPHORVVIURPGLVFRQWLQXHGRSHUDWLRQVQHWRIWD[HV
1HWLQFRPH
Earnings per share attributable to Quest Diagnostics’ common
stockholders - basic:
,QFRPHIURPFRQWLQXLQJRSHUDWLRQV
,QFRPHORVVIURPGLVFRQWLQXHGRSHUDWLRQV
1HWLQFRPH
Earnings per share attributable to Quest Diagnostics’ common
stockholders - diluted:
,QFRPHIURPFRQWLQXLQJRSHUDWLRQV
,QFRPHORVVIURPGLVFRQWLQXHGRSHUDWLRQV
1HWLQFRPH
Dividends per common share
7KHDFFRPSDQ\LQJQRWHVDUHDQLQWHJUDOSDUWRIWKHVHVWDWHPHQWV
48(67',$*1267,&6)250.