Quest Diagnostics 2002 Annual Report Download - page 3
Download and view the complete annual report
Please find page 3 of the 2002 Quest Diagnostics annual report below. You can navigate through the pages in the report by either clicking on the pages listed below, or by using the keyword search tool below to find specific information within the annual report.-
 1
1 -
 2
2 -
 3
3 -
 4
4 -
 5
5 -
 6
6 -
 7
7 -
 8
8 -
 9
9 -
 10
10 -
 11
11 -
 12
12 -
 13
13 -
 14
14 -
15
-
16
-
17
-
18
-
19
-
20
-
21
-
22
-
23
-
24
-
25
-
26
-
27
-
28
-
29
-
30
-
31
-
32
-
33
-
34
-
35
-
36
-
37
-
38
-
39
-
40
-
41
-
42
-
43
-
44
-
45
-
46
-
47
-
48
-
49
-
50
-
51
-
52
-
53
-
54
-
55
-
56
-
57
-
58
-
59
-
60
-
61
-
62
-
63
-
64
-
65
-
66
-
67
-
68
-
69
-
70
-
71
-
72
-
73
-
74
-
75
-
76
-
77
-
78
-
79
-
80
-
81
-
82
-
83
-
84
-
85
-
86
-
87
-
88
-
89
-
90
-
91
-
92
-
93
-
94
-
95
-
96
-
97
-
98
-
99
-
100
-
101
-
102
-
103
-
104
-
105
-
106
-
107
 |
 |

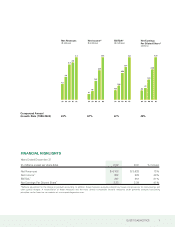
Net Revenues
($ billions)
Net Income*
($ millions)
Net Earnings
Per Diluted Share*
(dollars)
Compound Annual
Growth Rate (1998-2002) 30% 67% 47% 48%
EBITDA*
($ millions)
FINANCIAL HIGHLIGHTS
Years Ended December 31
(in millions, except per share data) 2002 2001 % Increase
Net Revenues $ 4,108 $ 3,628 13%
Net Income*322 223 44%
EBITDA*727 557 31%
Net Earnings Per Diluted Share*3.23 2.29 41%
*Reflects adjustment for the change in goodwill accounting. In addition, these measures exclude extraordinary losses and provisions for restructurings and
other special charges. A reconciliation of these measures and the most directly comparable financial measures under generally accepted accounting
principles can be found on our website at: www.questdiagnostics.com.
QUEST DIAGNOSTICS 1