Public Storage 2010 Annual Report Download - page 6
Download and view the complete annual report
Please find page 6 of the 2010 Public Storage annual report below. You can navigate through the pages in the report by either clicking on the pages listed below, or by using the keyword search tool below to find specific information within the annual report.-
 1
1 -
 2
2 -
 3
3 -
 4
4 -
 5
5 -
 6
6 -
 7
7 -
 8
8 -
 9
9 -
 10
10 -
 11
11 -
 12
12 -
 13
13 -
 14
14 -
 15
15 -
 16
16 -
 17
17 -
18
-
19
-
20
-
21
-
22
-
23
-
24
-
25
-
26
-
27
-
28
-
29
-
30
-
31
-
32
-
33
-
34
-
35
-
36
-
37
-
38
-
39
-
40
-
41
-
42
-
43
-
44
-
45
-
46
-
47
-
48
-
49
-
50
-
51
-
52
-
53
-
54
-
55
-
56
-
57
-
58
-
59
-
60
-
61
-
62
-
63
-
64
-
65
-
66
-
67
-
68
-
69
-
70
-
71
-
72
-
73
-
74
-
75
-
76
-
77
-
78
-
79
-
80
-
81
-
82
-
83
-
84
-
85
-
86
-
87
-
88
-
89
-
90
-
91
-
92
-
93
-
94
-
95
-
96
-
97
-
98
-
99
-
100
-
101
-
102
-
103
-
104
-
105
-
106
-
107
-
108
-
109
-
110
-
111
-
112
-
113
-
114
-
115
-
116
-
117
-
118
-
119
-
120
-
121
-
122
-
123
-
124
-
125
-
126
-
127
-
128
 |
 |

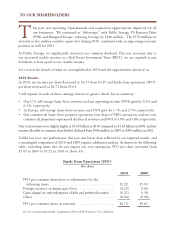
For the reasons outlined in last year’s letter, we anticipate that significant acquisition activity will
continue into 2011.
Capital Transactions
In 2010, the capital markets normalized and access to capital improved. We issued about $300
million of senior preferred shares and the net proceeds were used in part to redeem about $500
million of Equity Shares, Series A and preferred securities.
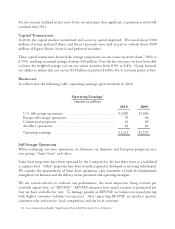
our ability to reduce this cost on our $3.8 billion of preferred will be five to ten basis points at best.
Businesses
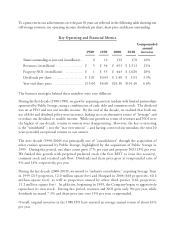
As reflected in the following table, operating earnings1 grew modestly in 2010.
Operating Earnings1
(Amounts in millions)
2010 2009
Europe self-storage operations 70 66
Commercial properties 61 65
Ancillary operations 62 62
Operating earnings $1,213 $1,197
Self-Storage Operations
When evaluating our store operations, we bifurcate our domestic and European properties into
two groups–“Same Store” and other.
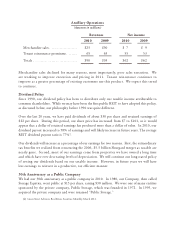
Same Store properties have been operated by the Company for the last three years at a stabilized
occupancy level. “Other” properties have been recently acquired or developed or are being redeveloped.
We consider the measurement of Same Store operations a key barometer of both the fundamental
strength of our business and the efficacy of our personnel and operating strategies.
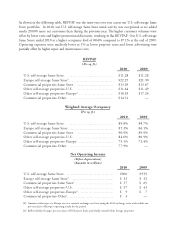
We use certain metrics to evaluate our performance, the most important being revenue per
available square feet, or “REVPAF.” REVPAF measures how much revenue is generated per
foot we have available for rent. To manage growth in REVPAF, we balance increased pricing
with higher customer volumes (occupancy). Also impacting REVPAF are product quality,
customer sales and service, local competition and the local economy.
(1) See accompanying schedule “Supplemental Non-GAAP Disclosure” for a definition.