Public Storage 2010 Annual Report Download - page 4
Download and view the complete annual report
Please find page 4 of the 2010 Public Storage annual report below. You can navigate through the pages in the report by either clicking on the pages listed below, or by using the keyword search tool below to find specific information within the annual report.-
 1
1 -
 2
2 -
 3
3 -
 4
4 -
 5
5 -
 6
6 -
 7
7 -
 8
8 -
 9
9 -
 10
10 -
 11
11 -
 12
12 -
 13
13 -
 14
14 -
 15
15 -
16
-
17
-
18
-
19
-
20
-
21
-
22
-
23
-
24
-
25
-
26
-
27
-
28
-
29
-
30
-
31
-
32
-
33
-
34
-
35
-
36
-
37
-
38
-
39
-
40
-
41
-
42
-
43
-
44
-
45
-
46
-
47
-
48
-
49
-
50
-
51
-
52
-
53
-
54
-
55
-
56
-
57
-
58
-
59
-
60
-
61
-
62
-
63
-
64
-
65
-
66
-
67
-
68
-
69
-
70
-
71
-
72
-
73
-
74
-
75
-
76
-
77
-
78
-
79
-
80
-
81
-
82
-
83
-
84
-
85
-
86
-
87
-
88
-
89
-
90
-
91
-
92
-
93
-
94
-
95
-
96
-
97
-
98
-
99
-
100
-
101
-
102
-
103
-
104
-
105
-
106
-
107
-
108
-
109
-
110
-
111
-
112
-
113
-
114
-
115
-
116
-
117
-
118
-
119
-
120
-
121
-
122
-
123
-
124
-
125
-
126
-
127
-
128
 |
 |

TO OUR SHAREHOLDERS
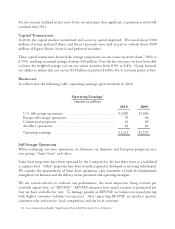
his past year operating fundamentals and acquisition opportunities improved for all
our businesses. We continued to “deleverage,” with Public Storage, PS Business Parks
(PSB) and Shurgard Europe, reducing leverage by $240 million. The $570 million we
invested in five million rentable square feet during 2010 combined with an improving economy
position us well for 2011.
At Public Storage, we significantly increased our common dividend. This was necessary due to
our increased taxable income; as a Real Estate Investment Trust (REIT), we are required to pay
dividends at least equal to our taxable income.
Let’s review the details of what we accomplished in 2010 and the opportunities ahead of us.
2010 Results
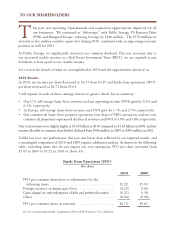
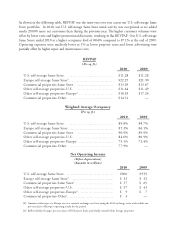
In 2010, net income per share decreased to $2.35 from $3.47 and funds from operations (FFO)1
per share decreased to $4.72 from $5.61.
I will expand on each of these earnings metrics in greater detail, but in summary:
Our total revenues were slightly higher at $1.65 billion in 2010 compared to $1.62 billion in 2009, and net
income allocable to common shareholders declined from $586 million in 2009 to $399 million in 2010.
a meaningful comparison of 2010 and 2009 requires additional analysis. As shown in the following
table, excluding items that do not impact our core operations, FFO per share increased from
Funds From Operations (FFO)1
(Per share)
2010 2009
FFO per common share prior to adjustments for the
following items $5.22 $5.03
Foreign currency exchange gain (loss) (0.25) 0.06
Gain (charge) on early redemption of debt and preferred securities (0.21) 0.58
Other (0.04) (0.06)
FFO per common share, as reported $4.72 $5.61
T
(1) See accompanying schedule “Supplemental Non-GAAP Disclosures” for a definition.