Progressive 2012 Annual Report Download - page 5
Download and view the complete annual report
Please find page 5 of the 2012 Progressive annual report below. You can navigate through the pages in the report by either clicking on the pages listed below, or by using the keyword search tool below to find specific information within the annual report.-
 1
1 -
 2
2 -
 3
3 -
 4
4 -
 5
5 -
 6
6 -
 7
7 -
 8
8 -
 9
9 -
 10
10 -
 11
11 -
 12
12 -
 13
13 -
 14
14 -
 15
15 -
 16
16 -
17
-
18
-
19
-
20
-
21
-
22
-
23
-
24
-
25
-
26
-
27
-
28
-
29
-
30
-
31
-
32
-
33
-
34
-
35
-
36
-
37
-
38
-
39
-
40
-
41
-
42
-
43
-
44
-
45
-
46
-
47
-
48
-
49
-
50
-
51
-
52
-
53
-
54
-
55
-
56
-
57
-
58
-
59
-
60
-
61
-
62
-
63
-
64
-
65
-
66
-
67
-
68
-
69
-
70
-
71
-
72
-
73
-
74
-
75
-
76
-
77
-
78
-
79
-
80
-
81
-
82
-
83
-
84
-
85
-
86
-
87
-
88
 |
 |

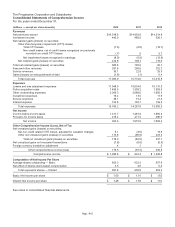
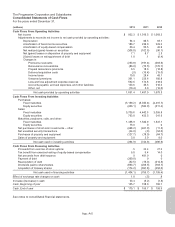
The Progressive Corporation and Subsidiaries
Consolidated Statements of Cash Flows
For the years ended December 31,
(millions) 2012 2011 2010
Cash Flows From Operating Activities
Net income $ 902.3 $ 1,015.5 $ 1,068.3
Adjustments to reconcile net income to net cash provided by operating activities:
Depreciation 94.4 88.5 83.1
Amortization of fixed-income securities 186.7 233.0 229.2
Amortization of equity-based compensation 63.4 50.5 45.9
Net realized (gains) losses on securities (306.8) (102.6) (96.1)
Net (gains) losses on disposition of property and equipment 7.1 8.7 2.3
(Gains) losses on extinguishment of debt 1.8 .1 (6.4)
Changes in:
Premiums receivable (253.8) (191.4) (283.6)
Reinsurance recoverables (83.0) (76.5) (176.7)
Prepaid reinsurance premiums 3.5 18.3 (18.8)
Deferred acquisition costs (.9) (16.4) (15.0)
Income taxes 19.8 28.4 48.1
Unearned premiums 351.1 225.6 180.8
Loss and loss adjustment expense reserves 592.6 174.8 418.0
Accounts payable, accrued expenses, and other liabilities 123.6 35.5 210.2
Other, net (10.4) 5.9 (10.0)
Net cash provided by operating activities 1,691.4 1,497.9 1,679.3
Cash Flows From Investing Activities
Purchases:
Fixed maturities (5,199.2) (6,032.4) (4,491.7)
Equity securities (463.1) (582.0) (511.4)
Sales:
Fixed maturities 3,705.6 4,442.6 3,055.8
Equity securities 793.0 423.5 241.9
Maturities, paydowns, calls, and other:
Fixed maturities 1,488.9 1,540.9 1,341.1
Equity securities 16.0 0 0
Net purchases of short-term investments – other (438.2) (461.0) (11.5)
Net unsettled security transactions (44.0) (.6) (54.0)
Purchases of property and equipment (127.7) (78.9) (64.7)
Sales of property and equipment 3.8 3.0 8.0
Net cash used in investing activities (264.9) (744.9) (486.5)
Cash Flows From Financing Activities
Proceeds from exercise of stock options .5 22.4 27.2
Tax benefit from exercise/vesting of equity-based compensation 5.8 6.4 14.0
Net proceeds from debt issuance 0 491.9 0
Payment of debt (350.0) 0 0
Reacquisition of debt (32.5) (15.0) (214.3)
Dividends paid to shareholders (853.7) (263.6) (763.7)
Acquisition of treasury shares (174.2) (997.8) (258.6)
Net cash used in financing activities (1,404.1) (755.7) (1,195.4)
Effect of exchange rate changes on cash 1.0 (.5) .8
Increase (decrease) in cash 23.4 (3.2) (1.8)
Cash, Beginning of year 155.7 158.9 160.7
Cash, End of year $ 179.1 $ 155.7 $ 158.9
See notes to consolidated financial statements.
App.-A-5