Progressive 2012 Annual Report Download - page 11
Download and view the complete annual report
Please find page 11 of the 2012 Progressive annual report below. You can navigate through the pages in the report by either clicking on the pages listed below, or by using the keyword search tool below to find specific information within the annual report.
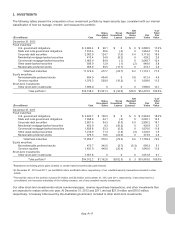
2. INVESTMENTS
The following tables present the composition of our investment portfolio by major security type, consistent with our internal
classification of how we manage, monitor, and measure the portfolio:
($ in millions) Cost
Gross
Unrealized
Gains
Gross
Unrealized
Losses
Net
Realized
Gains
(Losses)1
Fair
Value
%of
Total
Fair
Value
December 31, 2012
Fixed maturities:
U.S. government obligations $ 2,806.4 $ 90.1 $ 0 $ 0 $ 2,896.5 17.6%
State and local government obligations 1,914.4 50.6 (.6) 0 1,964.4 11.9
Corporate debt securities 2,982.9 124.7 (1.0) 6.4 3,113.0 18.9
Residential mortgage-backed securities 413.4 24.0 (9.2) 0 428.2 2.6
Commercial mortgage-backed securities 1,963.9 84.9 (.1) 0 2,048.7 12.4
Other asset-backed securities 936.0 12.9 (.1) (.2) 948.6 5.8
Redeemable preferred stocks 356.9 30.5 (12.7) 0 374.7 2.3
Total fixed maturities 11,373.9 417.7 (23.7) 6.2 11,774.1 71.5
Equity securities:
Nonredeemable preferred stocks 404.0 404.6 0 3.8 812.4 4.9
Common equities 1,370.3 539.0 (10.3) 0 1,899.0 11.5
Short-term investments:
Other short-term investments 1,990.0 0 0 0 1,990.0 12.1
Total portfolio2,3 $15,138.2 $1,361.3 $ (34.0) $10.0 $16,475.5 100.0%
($ in millions) Cost
Gross
Unrealized
Gains
Gross
Unrealized
Losses
Net
Realized
Gains
(Losses)1
Fair
Value
%of
Total
Fair
Value
December 31, 2011
Fixed maturities:
U.S. government obligations $ 2,842.7 $ 120.3 $ 0 $ 0 $ 2,963.0 18.6%
State and local government obligations 1,938.6 64.1 (.6) 0 2,002.1 12.5
Corporate debt securities 2,801.5 94.3 (6.5) 6.9 2,896.2 18.1
Residential mortgage-backed securities 452.9 9.3 (35.3) 0 426.9 2.7
Commercial mortgage-backed securities 1,829.8 52.3 (5.5) 0 1,876.6 11.8
Other asset-backed securities 1,210.9 11.3 (1.3) (.3) 1,220.6 7.6
Redeemable preferred stocks 379.3 18.6 (24.0) 0 373.9 2.3
Total fixed maturities 11,455.7 370.2 (73.2) 6.6 11,759.3 73.6
Equity securities:
Nonredeemable preferred stocks 473.7 342.6 (3.7) (6.3) 806.3 5.1
Common equities 1,431.0 440.0 (25.4) 0 1,845.6 11.6
Short-term investments:
Other short-term investments 1,551.8 0 0 0 1,551.8 9.7
Total portfolio2,3 $14,912.2 $1,152.8 $(102.3) $ .3 $15,963.0 100.0%
1Represents net holding period gains (losses) on certain hybrid securities (discussed below).
2At December 31, 2012 and 2011, we had $90.9 million and $46.9 million, respectively, of net unsettled security transactions included in other
assets.
3The total fair value of the portfolio includes $1.4 billion and $2.0 billion at December 31, 2012 and 2011, respectively, of securities held in a
consolidated, non-insurance subsidiary of the holding company, net of any unsettled security transactions.
Our other short-term investments include commercial paper, reverse repurchase transactions, and other investments that
are expected to mature within one year. At December 31, 2012 and 2011, we had $21.9 million and $10.0 million,
respectively, in treasury bills issued by the Australian government, included in other short-term investments.
App.-A-11


