Polaris 2010 Annual Report Download - page 10
Download and view the complete annual report
Please find page 10 of the 2010 Polaris annual report below. You can navigate through the pages in the report by either clicking on the pages listed below, or by using the keyword search tool below to find specific information within the annual report.-
 1
1 -
 2
2 -
 3
3 -
 4
4 -
 5
5 -
 6
6 -
 7
7 -
 8
8 -
 9
9 -
 10
10 -
 11
11 -
 12
12 -
 13
13 -
 14
14 -
 15
15 -
 16
16 -
 17
17 -
 18
18 -
 19
19 -
 20
20 -
 21
21 -
22
-
23
-
24
-
25
-
26
-
27
-
28
-
29
-
30
-
31
-
32
-
33
-
34
-
35
-
36
-
37
-
38
-
39
-
40
-
41
-
42
-
43
-
44
-
45
-
46
-
47
-
48
-
49
-
50
-
51
-
52
-
53
-
54
-
55
-
56
-
57
-
58
-
59
-
60
-
61
-
62
-
63
-
64
-
65
-
66
-
67
-
68
-
69
-
70
-
71
-
72
-
73
-
74
-
75
-
76
-
77
-
78
-
79
-
80
-
81
-
82
-
83
-
84
-
85
-
86
-
87
-
88
-
89
-
90
-
91
-
92
-
93
-
94
 |
 |

6
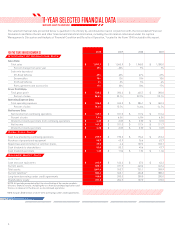
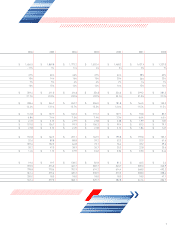
11YEAR SELECTED FINANCIAL DATA
The selected financial data presented below is qualified in its entirety by, and should be read in conjunction with, the Consolidated Financial
Statements and Notes thereto and other financial and statistical information, including the information referenced under the caption
“Management’s Discussion and Analysis of Financial Condition and Results of Operation,” located in the Form 10-K included in this report.
NOTE: All periods presented reflect the classification of the marine products
division’s financial results, including the loss from discontinued operations and
the loss on disposal of the division, as discontinued operations.
*2010 Includes $100 million of short-term borrowings under credit agreements.
IN MILLIONS, EXCEPT PER-SHARE DATA
FOR THE YEARS ENDED DECEMBER 31, 2010 2009 2008 2007
Statement of Operations Data
Sales Data:
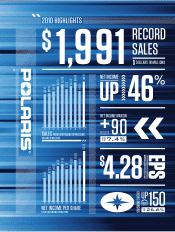
Total sales $1,991.1 $ 1,565.9 $ 1,948.3 $ 1,780.0
Percent change from prior year 27%–20%9%7%
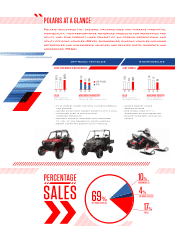
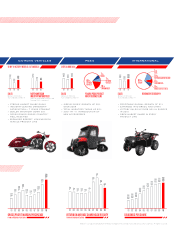
Sales mix by product:
Off-Road Vehicles 69%65%67%67%
Snowmobiles 10%12%10%10%
On-Road Vehicles 4%3%5%6%
Parts, garments and accessories 17%20%18%17%
Gross Profit Data:
Total gross profit $530.2 $ 393.2 $ 445.7 $ 393.0
Percent of sales 26.6%25.1%22.9%22.1%
Operating Expense Data:
Total operating expenses $326.3 $ 245.3 $ 284.1 $ 262.3
Percent of sales 16.4%15.7%14.6%14.7%
Net Income Data:
Net income from continuing operations $147.1 $ 101.0 $ 117.4 $ 112.6
Percent of sales 7.4%6.5%6.0%6.3%
Diluted net income per share from continuing operations $4.28 $ 3.05 $ 3.50 $ 3.10
Net income $147.1 $ 101.0 $ 117.4 $ 111.7
Diluted net income per share $4.28 $ 3.05 $ 3.50 $ 3.07
Cash Flow Data
Cash flow provided by continuing operations $297.9 $ 193.2 $ 176.2 $ 213.2
Purchase of property and equipment 55.7 43.9 76.6 63.7
Repurchase and retirement of common shares 27.5 4.6 107.2 103.1
Cash dividends to shareholders 53.0 50.2 49.6 47.7
Cash dividends per share $1.60 $ 1.56 $ 1.52 $ 1.36
Balance Sheet Data
(at end of year)
Cash and cash equivalents $393.9 $ 140.2 $ 27.2 $ 63.3
Current assets 808.1 491.5 443.6 447.6
Total assets 1,061.6 763.7 751.1 769.9
Current liabilities* 584.2 343.1 404.8 388.2
Long-term borrowings under credit agreements 100.0 200.0 200.0 200.0
Shareholders’ equity 371.0 204.5 137.0 173.0