Panasonic 2008 Annual Report Download - page 5
Download and view the complete annual report
Please find page 5 of the 2008 Panasonic annual report below. You can navigate through the pages in the report by either clicking on the pages listed below, or by using the keyword search tool below to find specific information within the annual report.-
 1
1 -
 2
2 -
 3
3 -
 4
4 -
 5
5 -
 6
6 -
 7
7 -
 8
8 -
 9
9 -
 10
10 -
 11
11 -
 12
12 -
 13
13 -
 14
14 -
 15
15 -
 16
16 -
17
-
18
-
19
-
20
-
21
-
22
-
23
-
24
-
25
-
26
-
27
-
28
-
29
-
30
-
31
-
32
-
33
-
34
-
35
-
36
-
37
-
38
-
39
-
40
-
41
-
42
-
43
-
44
-
45
-
46
-
47
-
48
-
49
-
50
-
51
-
52
-
53
-
54
-
55
-
56
-
57
-
58
-
59
-
60
-
61
-
62
-
63
-
64
-
65
-
66
-
67
-
68
-
69
-
70
-
71
-
72
-
73
-
74
-
75
-
76
-
77
-
78
-
79
-
80
-
81
-
82
-
83
-
84
-
85
-
86
-
87
-
88
-
89
-
90
-
91
-
92
-
93
-
94
-
95
-
96
-
97
-
98
-
99
-
100
-
101
-
102
-
103
-
104
-
105
-
106
-
107
-
108
-
109
-
110
-
111
-
112
-
113
-
114
 |
 |

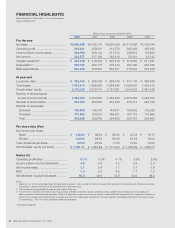
2004 2005 2006 2007 2008
Capital Investment
Depreciation
0
100
200
300
400
500
Operating Profit and
Operating Profit/Sales Ratio
Net Income and
Net Income/Sales Ratio
Stockholders’ Equity and ROE Capital Investment and Depreciation R&D Expenditures and
R&D Expenditures/Sales Ratio
Billions of yen % Billions of yen Billions of yen %
Billions of yen Billions of yen % Billions of yen %
Stockholders’ Equity [left scale]
ROE [right scale]
Net Sales
Domestic
Overseas
2004 2005 2006 2007 2008
0
2,000
4,000
6,000
8,000
10,000
Operating Profit [left scale]
Operating Profit/Sales Ratio [right scale]
2004 2005 2006 2007 2008
0
200
400
600
0
2.0
4.0
6.0
Net Income [left scale]
Net Income/Sales Ratio [right scale]
2004 2005 2006 2007 2008
0
100
200
300
400
0
1.0
2.0
3.0
4.0
2004 2005 2006 2007 2008
0
200
400
600
800
R&D Expenditures [left scale]
R&D Expenditures/Sales Ratio [right scale]
0
2.0
4.0
6.0
8.0
2004 2005 2006 2007 2008
0
1,000
2,000
3,000
4,000
0
2.0
4.0
6.0
8.0
Matsushita Electric Industrial Co., Ltd. 2008 3