PSE&G 2006 Annual Report Download - page 3
Download and view the complete annual report
Please find page 3 of the 2006 PSE&G annual report below. You can navigate through the pages in the report by either clicking on the pages listed below, or by using the keyword search tool below to find specific information within the annual report.-
 1
1 -
 2
2 -
 3
3 -
 4
4 -
 5
5 -
 6
6 -
 7
7 -
 8
8 -
 9
9 -
 10
10 -
 11
11 -
 12
12 -
 13
13 -
 14
14 -
15
-
16
-
17
-
18
-
19
-
20
-
21
-
22
-
23
-
24
-
25
-
26
-
27
-
28
 |
 |

While the forward looking statements about PSEG’s expectations made throughout this report are based on information currently
available and on reasonable assumptions, actual results could be materially different. Historical results are not necessarily
indicative of future earnings. For more information, please refer to PSEG reports that are filed periodically with the Securities
and Exchange Commission.
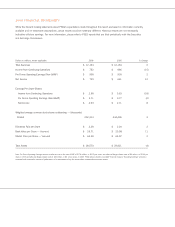
2006 financial highlights
Dollars in millions, where applicable 2006 2005 % Change
Total Revenues $ 12,164 $ 12,164 0
Income from Continuing Operations $ 752 $ 886 (15)
Pro Forma Operating Earnings (Non-GAAP) $ 938 $ 918 2
Net Income $ 739 $ 661 12
Earnings Per Share-Diluted
Income from Continuing Operations $ 2.98 $ 3.63 (18)
Pro Forma Operating Earnings (Non-GAAP) $ 3.71 $ 3.77 (2)
Net Income $ 2.93 $ 2.71 8
Weighted average common stock shares outstanding — (thousands)
Diluted 252,314 244,406 3
Dividends Paid per Share $ 2.28 $ 2.24 2
Book Value per Share — Year-end $ 26.71 $ 23.98 11
Market Price per Share — Year-end $ 66.38 $ 64.97 2
Total Assets $ 28,570 $ 29,821 (4)
Note: Pro Forma Operating Earnings exclude an after-tax loss on the sale of RGE of $178 million, or $0.70 per share, and after-tax Merger-related costs of $8 million, or $0.03 per
share, in 2006 and after-tax Merger-related costs of $32 million, or $0.14 per share, in 2005. PSEG believes that the non-GAAP financial measure “Operating Earnings” provides a
consistent and comparable measure of performance of its businesses to help the shareholders understand performance trends.