PACCAR 2011 Annual Report Download
Download and view the complete annual report
Please find the complete 2011 PACCAR annual report below. You can navigate through the pages in the report by either clicking on the pages listed below, or by using the keyword search tool below to find specific information within the annual report.-
 1
1 -
 2
2 -
 3
3 -
 4
4 -
 5
5 -
 6
6 -
 7
7 -
 8
8 -
 9
9 -
 10
10 -
 11
11 -
 12
12 -
13
-
14
-
15
-
16
-
17
-
18
-
19
-
20
-
21
-
22
-
23
-
24
-
25
-
26
-
27
-
28
-
29
-
30
-
31
-
32
-
33
-
34
-
35
-
36
-
37
-
38
-
39
-
40
-
41
-
42
-
43
-
44
-
45
-
46
-
47
-
48
-
49
-
50
-
51
-
52
-
53
-
54
-
55
-
56
-
57
-
58
-
59
-
60
-
61
-
62
-
63
-
64
-
65
-
66
-
67
-
68
-
69
-
70
-
71
-
72
-
73
-
74
-
75
-
76
-
77
-
78
-
79
-
80
-
81
-
82
-
83
-
84
-
85
-
86
-
87
-
88
-
89
-
90
 |
 |

2011 ANNUAL REPORT
Table of contents
-
Page 1
2 0 1 1 A N N U A L R E P O R T -
Page 2
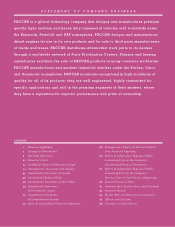
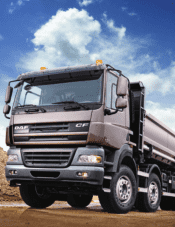
... S S PACCAR is a global technology company that designs and manufactures premium quality light, medium and heavy duty commercial vehicles sold worldwide under the Kenworth, Peterbilt and DAF nameplates. PACCAR designs and manufactures diesel engines for use in its own products and for sale to third... -
Page 3
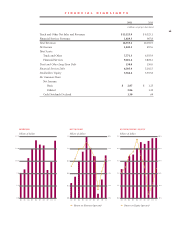
... S 2011 2010  (millions except per share data) Truck and Other Net Sales and Revenues Financial Services Revenues Total Revenues Net Income Total Assets: Truck and Other Financial Services Truck and Other Long-Term Debt Financial Services Debt Stockholders' Equity Per Common Share: Net Income... -
Page 4
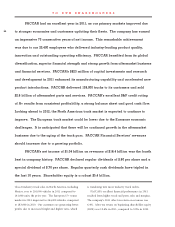
.... PACCAR's $823 million of capital investments and research and development in 2011 enhanced its manufacturing capability and accelerated new product introductions. PACCAR delivered 138,000 trucks to its customers and sold $2.6 billion of aftermarket parts and services. PACCAR's excellent S&P credit... -
Page 5
... list. Nearly 26,000 dealers, customers, suppliers and employees have experienced the company's Technology Centers highlighting surface computing, tablet PCs, an electronic leasing and finance office, and an electronic service analyst. TRUCKS - U.S. and Canadian Class 8 industry retail sales... -
Page 6
...Kenworth's T700, powered by the PACCAR MX engine, earned the American Truck Dealers heavy-duty "Commercial Truck of the Year" award. Nearly 55% of PACCAR's revenue was generated outside the United States. The company has realized excellent synergies globally in product development, sales and finance... -
Page 7
... pools, car pools and bus passes for 30% of their business commuting. A LOOK AHEAD - PACCAR's 23,400 employees enabled the company to distinguish itself as a global leader in the technology, capital goods, financial services and aftermarket parts businesses. Superior product quality, technological... -
Page 8
-
Page 9
... Program, specializing in heavy-duty commercial vehicle repair and maintenance skills. The "DAF Experience 2011" enabled thousands of customers and prospects to tour DAF's modern production facilities and state-of-the-art engine test center. Visitors experienced the PACCAR Technology Center... -
Page 10
-
Page 11
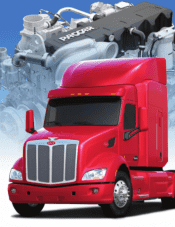
... achieved its highest production rate ever at the Denton Plant in 2011. The Peterbilt dealer network expanded to a record 260 locations throughout the U.S. and Canada. Peterbilt combines state-of-the-art aerodynamics with the industry-leading performance and fuel economy of PACCAR's MX engine to... -
Page 12
-
Page 13
... World's Best. * Kenworth received the highest numerical score for heavy-duty truck dealer service in the proprietary J.D. Power and Associates 2011 Heavy Duty Truck Customer Satisfaction StudySM. Heavy-Duty study based on 1,651 primary maintainers of 2010 model-year Class 8 heavy-duty trucks and... -
Page 14
... and operating performance. PACCAR Parts delivered record sales in 2011, as dealers expanded their sales and service business in a recovering economy. PACCAR Australia customers are supported by the most extensive dealer network in the market, with 37 locations providing parts and service. Kenworth... -
Page 15
... E X I C O PACCAR Mexico (KENMEX) increased sales and production by 54% in 2011 and earned a record 45% market share in the Class 8 truck market in Mexico. KENMEX has manufactured 185,000 vehicles since its founding in 1959.  KENMEX produces a broad range of Kenworth, DAF and Peterbilt Class... -
Page 16
...Kingdom's leading truck manufacturer, celebrated its 13th  anniversary as a PACCAR company. Leyland delivered over 14,400 DAF vehicles to customers in Europe, Australia, Africa and North America - a 57% increase over 2010. Leyland's highly efficient 710,000-square-foot manufacturing facility... -
Page 17
... site in Ponta Grossa, Brasil. The facility is scheduled for completion in 2013 and is designed to assemble the DAF LF, CF and XF models. The Brasilian truck market in 2011 was 162,000 units in the 6+ tonne class. PACCAR launched the DAF CF and LF product range in the Andean region of South America... -
Page 18
.... TRP rewards customers with the highest quality parts and cost-effective choices for vehicle repair and maintenance. PACCAR Parts launched TruckerLink, an advanced wireless telematics fleet management application. This innovative product benefits customers with fuel-conserving technology, real-time... -
Page 19
... design capacity with construction of engine test cells at the new DAF facility in Brasil. PACCAR engine factories in The Netherlands and Columbus, Mississippi, represent technology leadership in commercial vehicle diesel engine production. PACCAR engines are standard in DAF, Kenworth and Peterbilt... -
Page 20
...leading financial services provider to DAF dealers and customers in 16 Western and Central European countries. PFE achieved a record 24% retail market share in 2011. PFS sold more than 8,600 pre-owned PACCAR trucks worldwide in 2011. PFS added a third retail used truck center in Salt Lake City, Utah... -
Page 21
... to customers. PacLease is a leader with the introduction of new technologies, such as hybrid vehicles, on-board telematics and alternative fueled vehicles. PacLease placed its 1,000th MX-powered truck into North American service during 2011. Kenworth and Peterbilt vehicles with PACCAR MX engines... -
Page 22
... S PACCAR Technical Centers' world-class testing facilities and advanced simulation  technologies accelerate product development and ensure that PACCAR continues to deliver the highest-quality products in the industry. PACCAR's Technical Centers in Europe and North America are equipped with... -
Page 23
... networks. ITD's 680 employees collaborate with PACCAR divisions using technology to enhance manufacturing, financial services and engineering design. This year ITD partnered with the PACCAR Engine Company to expand production capabilities at the Columbus engine factory and introduce PACCAR Engine... -
Page 24
... Class 8 Units PACCAR Market Share (percent) T O TA L A S S E T S GEOGRAPHIC REVENUE billions of dollars 17.5 17.5 billions of dollars 14.0 14.0 10.5 10.5 7.0 7.0 3.5 3.5 0.0 02 03 04 05 06 07 08 09 10 11 0.0 02 03 04 05 06 07 08 09 10 11 â- Truck and Other â- Financial Services... -
Page 25
... years ending December 31, 2011. Effective January 1, 2011, the Company revised its peer group to better reflect global manufacturing and the cyclicality of the commercial vehicle industry. Standard & Poor's has calculated a return for each company in both the Current Peer Group Index and the Prior... -
Page 26
.... The Company's Financial Services segment (PFS) derives its earnings primarily from financing or leasing PACCAR products in the U.S., Canada, Mexico, Europe and Australia. The Company's Other business is the manufacturing and marketing of industrial winches. Consolidated net sales and revenues of... -
Page 27
... of operations. 2011 Compared to 2010: Truck PACCAR's Truck segment accounted for 93% and 90% of revenues in 2011 and 2010, respectively. ($ in millions) Year Ended December 31, 2011 2010 % CHANGE Truck net sales and revenues: U.S. and Canada Europe Mexico, South America, Australia and other Truck... -
Page 28
... Canada increased to 197,000 units in 2011 compared to 126,000 units in 2010. The Company's heavy-duty truck retail market share was a record 28.1% in 2011 compared to 24.1% in 2010, reflecting overall strong demand for the Company's premium products and increased deliveries to large fleet customers... -
Page 29
...฀market฀demand. Truck฀R&D฀expenditures฀increased฀to฀$287.5฀million฀in฀2011฀from฀$238.2฀million฀in฀2010.฀The฀higher฀spending฀in฀ 2011฀reflects฀increased฀new฀product฀development฀activities,฀primarily฀for฀new฀truck฀products฀for฀North... -
Page 30
...Financial Services ($ in millions) Year ended December 31, 2011 2010 % CHANGE New loan and lease volume: U.S. and Canada Europe Mexico and Australia New loan and lease volume by product: Loans and finance leases Equipment on operating lease New loan and lease unit volume: Loans and finance leases... -
Page 31
... in millions) Year ended December 31, 2011 2010 Operating lease revenues Used฀truck฀sales฀and฀other฀ Operating leases, rental and other income Depreciation of equipment on operating leases Vehicle operating expenses Cost฀of฀used฀truck฀sales฀and฀other฀ Depreciation and other... -
Page 32
... operating lease units that are being leased) of $4.4 million, higher lease rates of $13.5 million and higher fuel and service revenue of $3.9 million. The 2011 increase in costs per asset of $17.6 million is due to higher vehicle operating expenses, including higher fuel costs and variable costs... -
Page 33
... modified and the customers continued to not make payments, past-dues of 5.8% in Mexico and Australia would have been 6.8%.  The Company's 2011 pretax return on revenue for Financial Services increased to 23.0% from 15.9% in 2010 primarily due to higher finance and lease margins. The higher... -
Page 34
...higher return on revenues in truck operations. 2010 Compared to 2009: Truck PACCAR's Truck segment accounted for 90% and 86% of revenues in 2010 and 2009, respectively. ($ in millions) Year ended December 31, 2010 2009 % CHANGE Truck net sales and revenues: U.S. and Canada Europe Mexico, Australia... -
Page 35
... EPA 2010 emission vehicles in the U.S. and Canada Factory฀overhead,฀warehouse฀and฀other฀indirect฀costs฀increased฀$89.7฀million฀primarily฀due฀to฀higher฀supplies฀ and maintenance ($38.6 million) and salaries and related costs ($16.5 million) to support higher production... -
Page 36
... 2009 due to higher sales volumes. Financial Services ($ in millions) Year ended December 31, 2010 2009 % CHANGE New loan and lease volume: U.S. and Canada Europe Mexico and Australia New loan and lease volume by product: Loans and finance leases Equipment on operating lease New loan and lease unit... -
Page 37
...loan and lease volume increased due to higher retail truck sales ($313.4 million) as well as higher average amounts financed per unit ($130.3 million). PFS increased its finance market share on new PACCAR trucks to 28% in 2010 from 26% in the prior year. Decreased Financial Services revenues in 2010... -
Page 38
...on repossessed operating lease equipment ($6.4 million Results฀on฀sales฀of฀trucks฀returned฀from฀leases฀improved฀$16.3฀million฀in฀2010฀also฀reflecting฀higher฀used฀truck฀ prices as a result of the increased demand for used trucks in an improving global economy The... -
Page 39
...The Company's 2010 pretax return on revenue for Financial Services increased to 15.9% from 8.4% in 2009 primarily due to higher lease margin from lower operating lease impairments and a decline in losses on the sale of lease returns, and a lower provision for losses from improving portfolio quality... -
Page 40
... addition, $758.4 million of operating cash flow was used for increased Financial Services segment wholesale receivables, sales-type finance leases and dealer direct loans in 2011 reflecting higher truck sales compared to 2010. Investing activities: Cash used in investing activities of $2.42 billion... -
Page 41
... higher truck production compared to 2009. Investing activities: Cash used in investing activities of $467.1 million in 2010 decreased $777.7 million from the $310.6 million provided in 2009. In 2010, there were higher new loan and lease originations of $507.0 million in the Financial Services... -
Page 42
...and geographic expansion, including building a new DAF factory in Brasil. Spending on R&D in 2012 is expected to be $275 to $325 million. PACCAR will continue to focus on new product programs, engine development and manufacturing efficiency improvements. The Company conducts business in Spain, Italy... -
Page 43
...amount of commercial paper (up to one year) to 5.00 billion pesos. At December 31, 2011, 8.82 billion pesos remained available for issuance. PACCAR believes its Financial Services companies will be able to continue funding receivables, servicing debt and paying dividends through internally generated... -
Page 44
... statements. Operating Leases Trucks sold pursuant to agreements accounted for as operating leases are disclosed in Note E of the consolidated financial statements. In determining its estimate of the residual value of such vehicles, the Company considers the length of the lease term, the truck model... -
Page 45
... financial statements. The Company's accounting for employee pension benefit costs and obligations is based on management assumptions about the future used by actuaries to estimate net costs and liabilities. These assumptions include discount rates, long-term rates of return on plan assets... -
Page 46
... in the levels of the Financial Services segment new business volume due to unit fluctuations in new PACCAR truck sales; changes affecting the profitability of truck owners and operators; price changes impacting equipment costs and residual values; insufficient supplier capacity or access to raw... -
Page 47
...TRUCK AND OTHER: 2011 2010 2009  (millions, except per share data) Net sales and revenues Cost of sales and revenues Research and development Selling, general and administrative Curtailment gain Interest and other expense, net Truck and Other Income Before Income Taxes FINANCIAL SERVICES... -
Page 48
... 31, TRUCK AND OTHER: 2011 (millions) 2010 Current Assets Cash and cash equivalents Trade and other receivables, net Marketable debt securities Inventories, net Other current assets Total Truck and Other Current Assets Equipment on operating leases, net Property, plant and equipment, net Other... -
Page 49
...-term debt Residual value guarantees and deferred revenues Other liabilities Total Truck and Other Liabilities $ 2,377.4 250.3 2,627.7 150.0 712.0 507.0 3,996.7 $ 1,676.5 23.5 1,700.0 150.0 563.8 370.3 2,784.1 FINANCIAL SERVICES: Accounts payable, accrued expenses and other Commercial paper and... -
Page 50
... on new trucks Sales-type finance leases and dealer direct loans on new trucks Inventories Other assets, net Increase (decrease) in liabilities: Accounts payable and accrued expenses Residual value guarantees and deferred revenues Other liabilities, net Net Cash Provided by Operating Activities... -
Page 51
... STOCK, AT COST: Balance at beginning of year Purchases, shares: 2011-9.2 Retirements Balance at end of year RETAINED EARNINGS: (337.6) 337.6 17.4 (17.4) Balance at beginning of year Net income Cash dividends declared on common stock, per share: 2011-$1.30; 2010-$.69; 2009-$.54 Treasury stock... -
Page 52
...- and heavy-duty commercial trucks and related aftermarket parts and (2) finance and leasing products and services provided to customers and dealers. PACCAR's sales and revenues are derived primarily from North America and Europe. The Company also operates in Australia and sells trucks and parts to... -
Page 53
...-sale. These investments are stated at fair value with any unrealized gains or losses, net of tax, included as a component of accumulated other comprehensive income. The Company utilizes third-party pricing services for all of its marketable debt security valuations. The Company reviews the pricing... -
Page 54
...payment performance of all its finance receivables. The Company evaluates its finance receivables collectively and, in some cases, individually. For large customers and dealers with wholesale financing, the Company regularly reviews their financial statements and makes site visits and phone contacts... -
Page 55
... Company leases equipment under operating leases to customers in the Financial Services segment. In addition, in the Truck segment, equipment sold to customers in Europe subject to a residual value guarantee (RVG) by the Company is accounted for as an operating lease. Equipment is recorded at cost... -
Page 56
...EN TS December 31, 2011, 2010 and 2009 (currencies in millions)  Lease and guarantee periods generally range from three to seven years. Estimated useful lives of the equipment range from four to nine years. The Company reviews residual values of equipment on operating leases periodically to... -
Page 57
... on the Company's consolidated financial statements. In September 2011, the FASB issued ASU 2011-09, Employer Disclosure Requirements for Multiemployer Pension Plans. This amendment requires employers participating in material multi-employer pension and other postretirement benefit plans to provide... -
Page 58
... specific identification method. The proceeds from sales and maturities of marketable securities during 2011 were $1,142.4. Gross realized gains were $3.2, $.7 and $1.2 and gross realized losses were $1.3, $.1 and $.1 for the years ended December 31, 2011, 2010 and 2009, respectively. The fair value... -
Page 59
... loans and dealer wholesale financing on new trucks is shown in the operating section of the Consolidated Statements of Cash Flows since those receivables finance the sale of Company inventory. Annual minimum payments due on finance receivables are as follows: LOANS FINANCE LEASES 2012 2013 2014... -
Page 60
....2 103.9 $ 153.4 34.9 $ 5,953.2 110.1 $ 980.0 6.2 The recorded investment of finance receivables that are on non-accrual status in the wholesale segment and the fleet and owner/operator portfolio classes (see impaired loans below) as of December 31, 2011 are $18.4, $63.9 and $17.6, as compared to... -
Page 61
... assess credit risk. The Company's retail segment is subdivided into the fleet and owner/operator classes. Fleet consists of retail accounts with customers operating more than five trucks. All others are owner/ operator. All impaired loans have a specific reserve and are summarized as follows: 2011... -
Page 62
... N CI A L STATEM EN TS December 31, 2011, 2010 and 2009 (currencies in millions)  over 90 days past-due and other accounts on non-accrual status. The Company uses historical data and expectations about the future to estimate default rates for each credit quality indicator as of December 31... -
Page 63
... finance leases and equipment under operating lease. The Company records the vehicles as used truck inventory included in Financial Services other assets on the balance sheet. The balance of repossessed inventory at December 31, 2011 and 2010 is $16.0 and $15.6, respectively. Proceeds from the sales... -
Page 64
... 31, 2011, 2010 and 2009 (currencies in millions)  F. P R O P E RT Y, P L A N T A N D E Q U I P M E N T Property, plant and equipment include the following: At December 31, USEFUL LIVES 2011 2010 Land Buildings and improvements Machinery, equipment and production tooling Construction... -
Page 65
..., PACCAR's European finance subsidiary, PACCAR Financial Europe, had â,¬1,100.0 available for issuance under a â,¬1,500.0 medium-term note program registered with the London Stock Exchange. The program was renewed in the second quarter of 2011 and is renewable annually through the filing of a new... -
Page 66
... on the consolidated financial statements. L. EMPLOYEE BENEFITS Severance Costs: The Company did not incur significant severance expense in 2011 or 2010. During the year ended December 31, 2009, the Company incurred severance costs of $25.9. Defined Benefit Pension Plans: PACCAR has several defined... -
Page 67
... with applicable employee benefit and tax laws. The Company contributed $84.7 to its pension plans in 2011 and $61.8 in 2010. The Company expects to contribute in the range of $100.0 to $150.0 to its pension plans in 2012, of which $14.2 is estimated to satisfy minimum funding requirements. Annual... -
Page 68
... prior service cost are expected to be amortized into net pension expense in 2012. The accumulated benefit obligation for all pension plans of the Company, except for certain multi-employer and defined contribution plans was $1,594.9 at December 31, 2011 and $1,350.3 at December 31, 2010. -
Page 69
... December 31, 2011, 2010 and 2009, respectively. Metal and Electrical Engineering Industry Pension Fund is a multi-employer union plan incorporating all DAF employees in the Netherlands and is covered by a collective bargaining agreement that will expire on June 30, 2013. The Company's contributions... -
Page 70
... it generally matches employee contributions up to 5% of base wages. The largest plan is in the U.S. where participants are nonunion employees. The Company match in the U.S. was 5%, 3% and 1% in 2011, 2010 and 2009, respectively. Other plans are located in Australia, Canada, the Netherlands and... -
Page 71
... follows: At December 31, 2011 2010 Assets: Accrued expenses Postretirement benefit plans Net operating loss carryforwards Allowance for losses on receivables Tax credit carryforwards Other Valuation allowance Liabilities: Financial Services leasing depreciation Depreciation and amortization Other... -
Page 72
... in the total amount of unrecognized tax benefits in the next twelve months. As of December 31, 2011, the United States Internal Revenue Service has completed examinations of the Company's tax returns for all years through 2008. The Company's tax returns for other major jurisdictions remain subject... -
Page 73
... Changes: In 2011, the Company purchased and retired 9.2 million treasury shares. In April 2010, the Company retired .4 million of its common shares held as treasury stock. O . D E R I VAT I V E F I N A N C I A L I N S T R U M E N T S As part of its risk management strategy, the Company enters into... -
Page 74
...The following table presents the balance sheet locations and fair value of derivative financial instruments: At December 31, ASSETS 2011 LIABILITIES ASSETS 2010 LIABILITIES Derivatives designated under hedge accounting: Interest-rate contracts: Financial Services: Other assets Deferred taxes and... -
Page 75
...follows: Year Ended December 31, INTEREST-RATE CONTRACTS 2011 FOREIGNEXCHANGE CONTRACTS INTEREST-RATE CONTRACTS 2010 FOREIGNEXCHANGE CONTRACTS Truck and Other: Cost of sales and revenues Interest and other (income) expense, net Financial Services: Interest and other borrowing expenses Total P. FA... -
Page 76
...: The Company's marketable debt securities consist of municipal bonds, government obligations, investment-grade corporate obligations, commercial paper, asset-backed securities and term deposits. The fair value of U.S. government obligations is based on quoted prices in active markets. These... -
Page 77
..., fair values are estimated using discounted cash flow analysis based on current rates for comparable loans. Finance lease receivables and related allowance for credit losses provisions have been excluded from the accompanying table. Debt: The carrying amounts of financial services commercial paper... -
Page 78
...the fair market value of the Company's common stock at the date of grant. Options expire no later than ten years from the grant date and generally vest after three years. Restricted stock awards generally vest over three years or earlier upon meeting certain age and service requirements. The Company... -
Page 79
... and 2007 at a weighted-average fair value of $43.61. These awards vest after five years if the Company's earnings per share growth over the same five year period meet or exceed certain performance goals. No matching shares were granted under this program in 2011, 2010 or 2009. The fair value of the... -
Page 80
...in North America and Europe. The Financial Services segment is composed of finance and leasing products and services provided to truck customers and dealers. Revenues are primarily generated from operations in North America and Europe. Included in All Other is PACCAR's industrial winch manufacturing... -
Page 81
...2011, 2010 and 2009 (currencies in millions) Business Segment Data 2011 2010 2009  Net sales and revenues: Truck Less intersegment Net Truck All Other Truck and Other Financial Services... 971.0 Segment assets: Truck Other Cash and marketable securities Financial Services $ 4,685.3 185.3... -
Page 82
... of the Public Company Accounting Oversight Board (United States). Those standards require that we plan and perform the audit to obtain reasonable assurance about whether the financial statements are free of material misstatement. An audit includes examining, on a test basis, evidence supporting the... -
Page 83
... opinion on the company's internal control over financial reporting based on our audit. We conducted our audit in accordance with the standards of the Public Company Accounting Oversight Board (United States). Those standards require that we plan and perform the audit to obtain reasonable assurance... -
Page 84
...D ATA  2011 2010 2009 (millions except per share data) 2008 2007 Truck and Other Net Sales and Revenues Financial Services Revenues Total Revenues Net Income Net Income Per Share: Basic Diluted Cash Dividends Declared Per Share Total Assets: Truck and Other Financial Services Truck and... -
Page 85
... except per share data) 2011  Truck and Other: Net sales and revenues Cost of sales and revenues Research and development Financial Services: Revenues Interest and other borrowing expenses Depreciation and other expense Net Income Net Income Per Share: Basic Diluted 2010 $3,042.6 2,632.3 68... -
Page 86
... as shown in the following table: Fair Value Gains (Losses) C O N S O L I D AT E D : 2011 2010 Assets Cash equivalents and marketable securities TRUCK AND OTHER: $(13.8) $ (5.7)...to financial services debt Total (51.5) 35.8 41.2 $15.2 (40.2) 30.9 37.0 $ 27.2 Currency Risks - The Company enters... -
Page 87
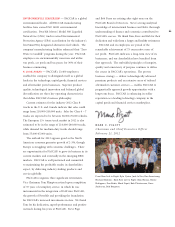
... Page Retired Vice Chairman and Chief Financial Officer United Technologies Corporation (1, 4) Robert T. Parry Retired President and Chief Executive Officer Federal Reserve Bank of San Francisco (1) John M. Pigott Partner Beta Business Ventures LLC (3) Thomas E. Plimpton Retired Vice Chairman PACCAR... -
Page 88
... Road N. Mississauga, Ontario L5N 4J8 Canada Factory: Ste-Thérèse, Quebec PACCAR Leasing Company Division of PACCAR Financial Corp. PACCAR Building 777 106th Avenue N.E. Bellevue, Washington 98004 DAF Trucks Test Center Weverspad 2 5491 RL St. Oedenrode The Netherlands Canadian Kenworth Company... -
Page 89
... It is also available online at www.paccar.com/investors/ investor_resources.asp, under SEC Filings. Annual Stockholders' Meeting April 24, 2012, 10:30 a.m. Meydenbauer Center 11100 N.E. Sixth Street Bellevue, Washington 98004 An Equal Opportunity Employer This report was printed on recycled paper. -
Page 90