Olympus 2014 Annual Report Download - page 17
Download and view the complete annual report
Please find page 17 of the 2014 Olympus annual report below. You can navigate through the pages in the report by either clicking on the pages listed below, or by using the keyword search tool below to find specific information within the annual report.-
 1
1 -
2
-
3
-
4
-
5
-
6
-
 7
7 -
 8
8 -
 9
9 -
 10
10 -
 11
11 -
 12
12 -
 13
13 -
 14
14 -
 15
15 -
 16
16 -
 17
17 -
 18
18 -
 19
19 -
 20
20 -
 21
21 -
 22
22 -
 23
23 -
 24
24 -
 25
25 -
 26
26 -
 27
27 -
28
-
29
-
30
-
31
-
32
-
33
-
34
-
35
-
36
-
37
-
38
-
39
-
40
-
41
-
42
-
43
-
44
-
45
-
46
-
47
-
48
-
49
-
50
-
51
-
52
-
53
-
54
-
55
-
56
-
57
-
58
-
59
-
60
 |
 |

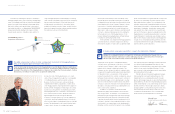
Composition (Fiscal year ended March 31, 2014)
Share of
Net Sales
(Consolidated net sales)
69.0%
Share of
Net Sales
by Product
Japan
21.5%
Others
2.5%
North America
35.7%
Europe
26.1%
Asia / Oceania
14.2%
Share of
Net Sales
by Region
Endoscopes
55.7%
Surgical &
endotherapy
devices
44.3%
Share of more than 70% of global gastrointestinal endoscope market
Technological capabilities that led to development of world’s
fi rst practical gastrocamera and have continued to lead innova-
tion since
Position as only manufacturer to deal in both imaging equip-
ment and energy devices
Network of more than 200 repair sites worldwide
Growing healthcare awareness; rising demand for early diag-
nosis methods due to spread of cancer prevention education
Increased demand for minimally invasive treatment methods
Insuffi cient number of physicians trained in endoscopic proce-
dures and room to improve medical techniques in emerging
countries
Progress in medical system reforms worldwide
Position as latecomer in surgical device fi eld after European
and U.S. companies
Insuffi cient lineup of surgical device products for procedures
requiring open surgery and other treatments
Defi cient development, manufacturing, and sales capabilities
for endotherapy and other disposable products
Strengthening of medical equipment regulations worldwide
Downward pressure on selling prices due to increased infl u-
ence of GPOs
Appearance of overseas rivals due to reorganization of medi-
cal equipment industry
Impacts of foreign exchange rate fl uctuations (yen appreciation)
S
O
W
T
Strengths
Opportunities
Weaknesses
Threats
Review of Business Segments
Message from the Group President
We will expand our business by providing world-leading services centered on early diagnosis and
minimally invasive treatment methods.
In the gastrointestinal endoscope eld, we are strengthening our operating foundation by leveraging new products intro-
duced into markets in Japan and abroad with the aim of solidifying our position as the world’s No. 1 manufacturer.
Meanwhile, the surgical device eld has been positioned as a future growth driver, and we plan to strengthen these opera-
tions by conducting strategic investments targeting long-term growth. Speci cally, we aim to rapidly grow surgical device
operations by expanding our market share in the energy device eld and strategically developing businesses in the
urology, gynecology, and ENT areas.
MEDICAL
BUSINESS
Akihiro Taguchi
President,
Medical Group
245.5
294.5
0
200
400
600
800
2012/3 2013/3
274.0
218.3
191.8
157.4
218.7
176.1
540.0
492.3
394.7
349.2
650.0
2015/3
(Forecast)
2017/3
(Target)
2014/3
0
40
80
120
160
0
20
10
30
40
50
150.0
115.0
112.7
87.1
68.2
20
22 21
23 23
2012/3 2013/3 2014/3 2015/3
(Forecast)
2017/3
(Target)
Net Sales
(¥ Billion)
Operating Income / Operating Margin
(¥ Billion) (%)
Operating income Operating margin (right) Endoscopes Surgical & endotherapy devices
Overview of Fiscal 2014
In gastrointestinal endoscopes, our mainstay business,
products introduced in fi scal 2013 made strong contribu-
tions to sales; EVIS EXERA III recorded impressive sales in
the United States while EVIS LUCERA ELITE performed
well in Japan.
In surgical devices, the VISERA ELITE integrated
video endoscopy system, which supports endoscopic
surgery, continued to record strong sales in Japan and
overseas. In addition, sales were robust for the 3D lapa-
roscopy surgical system launched in Japan, Europe,
and the United States. Also, the surgical energy device
THUNDERBEAT got off to a strong start after being intro-
duced into the Japanese market during the second half of
fi scal 2014. As a result of these factors, sales in the surgi-
cal device fi eld also increased.
Refl ecting the above, the Medical Business saw net
sales rise 25% year on year and operating income increase
30%, both setting new records, due to the benefi ts of new
product launches and yen depreciation.
Business Environment
In both developed countries, where populations are rapidly
aging, and emerging countries, which are experiencing
high economic growth, the improvement of patient quality
of life and control of both healthcare and social security
expenses have become urgent priorities. In the United
States, for example, the Affordable Care Act (ObamaCare)
has created a burgeoning trend toward effi ciency and
operational rationality in the medical industry. Olympus
possesses technologies for the development and manufac-
ture of products that meet needs spanning from those for
early diagnoses to those for minimally invasive treatments.
These technologies place the Company in a prime position
to contribute to the medical industry. By leveraging this
strength, Olympus will seek further business expansion
by providing technologies, products, services, and solutions
of the world’s highest caliber.
(Millions of yen)
2012/3 2013/3 2014/3
Operating Results
Net Sales 349,246 394,724 492,296
Operating Expenses 281,058 307,655 379,561
Operating Income 68,188 87,069 112,735
Operating Margin (%) 19.5 22.1 22.9
Sales by Product
Endoscopes 191,798 218,674 273,966
Domestic 43,803 47,335 57,136
Overseas 147,995 171,339 216,830
Surgical & Endotherapy 157,448 176,050 218,330
Domestic 36,615 42,177 48,735
Overseas 120,833 133,873 169,595
Segment Data
R&D Expenditures (¥ Billion) 26.9 31.3 34.4
Capital Expenditures (¥ Billion) 15.6 17.1 26.7
Number of Employees(*)16,225 16,552 18,345
* Including average number of temporary employees
31
OLYMPUS Annual Report 2014
30 OLYMPUS Annual Report 2014