Occidental Petroleum 2012 Annual Report Download - page 4
Download and view the complete annual report
Please find page 4 of the 2012 Occidental Petroleum annual report below. You can navigate through the pages in the report by either clicking on the pages listed below, or by using the keyword search tool below to find specific information within the annual report.-
 1
1 -
 2
2 -
 3
3 -
 4
4 -
 5
5 -
 6
6 -
 7
7 -
 8
8 -
 9
9 -
 10
10 -
 11
11 -
 12
12 -
 13
13 -
 14
14 -
 15
15 -
16
-
17
-
18
-
19
-
20
-
21
-
22
-
23
-
24
-
25
-
26
-
27
-
28
-
29
-
30
-
31
-
32
-
33
-
34
-
35
-
36
-
37
-
38
-
39
-
40
-
41
-
42
-
43
-
44
-
45
-
46
-
47
-
48
-
49
-
50
-
51
-
52
-
53
-
54
-
55
-
56
-
57
-
58
-
59
-
60
-
61
-
62
-
63
-
64
-
65
-
66
-
67
-
68
-
69
-
70
-
71
-
72
-
73
-
74
-
75
-
76
-
77
-
78
-
79
-
80
-
81
-
82
-
83
-
84
-
85
-
86
-
87
-
88
-
89
-
90
-
91
-
92
-
93
-
94
-
95
-
96
-
97
-
98
-
99
-
100
-
101
-
102
-
103
-
104
-
105
-
106
-
107
-
108
-
109
-
110
-
111
-
112
-
113
-
114
-
115
-
116
-
117
-
118
-
119
-
120
-
121
-
122
-
123
-
124
-
125
-
126
-
127
-
128
 |
 |

Part I
ITEMS 1 AND 2 BUSINESS AND PROPERTIES
GENERAL
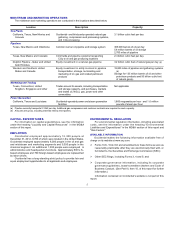
OIL AND GAS OPERATIONS
General
Proved Reserves and Sales Volumes
Comparative Oil and Gas Proved Reserves and Sales Volumes
2011 2010
Oil NGLs
Gas
BOE (a) Oil NGLs
Gas
BOE (a)
United States
1,526 225
3,365
2,313 1,460 237
3,034
2,203
International (b,c)
482
55
1,958
863
552
61
2,104
964
Total
2,008 280
5,323
3,176 (d) 2,012 298
5,138
3,167 (d)
United States
84 25
285
156 80 19
247
140
International (b,c)
80 4
162
111 83
5
172
117
Total
164 29
447
267 163 24
419
257
The detailed proved reserves information presented in accordance with Item 1202(a)(2) to Regulation S-K under the Securities Exchange Act of 1934 (Exchange Act) is provided on pages
75-78.
(a) Natural gas volumes have been converted to BOE based on energy content of six thousand cubic feet (Mcf) of gas to one barrel of oil. Barrels of oil equivalence does not necessarily result in
price equivalence. The price of natural gas on a barrel of oil equivalent basis is currently substantially lower than the corresponding price for oil and has been similarly lower over the
recent past. For example, in 2012, the average prices of West Texas Intermediate (WTI) oil and New York Mercantile Exchange (NYMEX) natural gas were $94.21 per barrel and $2.81
per Mcf, respectively, resulting in an oil to gas ratio of over 30.
(b) Excludes volumes from the Argentine operations sold in February 2011 and classified as discontinued operations.
(c) Reserves exclude the former noncontrolling interest in a Colombian subsidiary because, on December 31, 2010, Occidental restructured its Colombian operations to take a direct
working interest in the related assets. The 2010 sales volumes include the noncontrolling interest in the Colombian subsidiary, while the 2012 and 2011 sales volumes exclude such
amounts.
(d) Stated on a net basis after applicable royalties. Includes proved reserves related to production-sharing contracts (PSCs) and other similar economic arrangements of 0.9 billion BOE in
2012, 1.0 billion BOE in 2011 and 1.1 billion BOE in 2010.