Occidental Petroleum 2012 Annual Report Download - page 12
Download and view the complete annual report
Please find page 12 of the 2012 Occidental Petroleum annual report below. You can navigate through the pages in the report by either clicking on the pages listed below, or by using the keyword search tool below to find specific information within the annual report.-
 1
1 -
 2
2 -
 3
3 -
 4
4 -
 5
5 -
 6
6 -
 7
7 -
 8
8 -
 9
9 -
 10
10 -
 11
11 -
 12
12 -
 13
13 -
 14
14 -
 15
15 -
 16
16 -
 17
17 -
 18
18 -
 19
19 -
 20
20 -
 21
21 -
 22
22 -
23
-
24
-
25
-
26
-
27
-
28
-
29
-
30
-
31
-
32
-
33
-
34
-
35
-
36
-
37
-
38
-
39
-
40
-
41
-
42
-
43
-
44
-
45
-
46
-
47
-
48
-
49
-
50
-
51
-
52
-
53
-
54
-
55
-
56
-
57
-
58
-
59
-
60
-
61
-
62
-
63
-
64
-
65
-
66
-
67
-
68
-
69
-
70
-
71
-
72
-
73
-
74
-
75
-
76
-
77
-
78
-
79
-
80
-
81
-
82
-
83
-
84
-
85
-
86
-
87
-
88
-
89
-
90
-
91
-
92
-
93
-
94
-
95
-
96
-
97
-
98
-
99
-
100
-
101
-
102
-
103
-
104
-
105
-
106
-
107
-
108
-
109
-
110
-
111
-
112
-
113
-
114
-
115
-
116
-
117
-
118
-
119
-
120
-
121
-
122
-
123
-
124
-
125
-
126
-
127
-
128
 |
 |

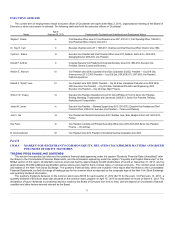
ITEM 6 SELECTED FINANCIAL DATA
FIVE-YEAR SUMMARY OF SELECTED FINANCIAL DATA
Dollar amounts in millions, except per-share amounts
As of and for the years ended December 31,
2011
2010
2009
2008
Net sales
$23,939 $19,045
$14,814
$23,713
Income from continuing operations (b)
$6,640 $4,569
$3,151
$7,183
Net income attributable to common stock
$6,771 $4,530
$2,915
$6,857
Basic earnings per common share from continuing operations (b)
$8.16 $5.62
$3.88
$8.77
Basic earnings per common share (b)
$8.32 $5.57
$3.59
$8.37
Diluted earnings per common share (b)
$8.32 $5.56
$3.58
$8.34
Total assets
$60,044 $52,432
$44,229
$41,537
Long-term debt, net
$5,871 $5,111
$2,557
$2,049
Stockholders’ equity
$37,620 $32,484
$29,159
$27,325
$75,992
$79,735
$66,050
$48,607
Cash provided by operating activities
$12,281 $9,566
$5,946
$10,765
Capital expenditures
$(7,518)
$(3,940)
$(3,245)
$(4,126)
Cash used by all other investing activities, net
$(2,385)(d) $(5,355)
$(2,221)
$(5,314)
Cash dividends paid
$(1,436)
$(1,159)
$(1,063)
$(940)
Cash provided (used) by all other financing activities, net
$261 $2,242
$30
$(570)
$1.84 $1.47
$1.31
$1.21
812,075 812,472
811,305
817,635
Note
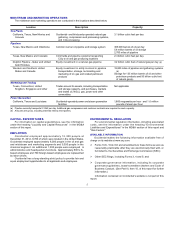
ITEM 7 AND 7A
MANAGEMENT'S DISCUSSION AND ANALYSIS OF FINANCIAL CONDITION AND
RESULTS OF OPERATIONS (MD&A)