North Face 2012 Annual Report Download - page 17
Download and view the complete annual report
Please find page 17 of the 2012 North Face annual report below. You can navigate through the pages in the report by either clicking on the pages listed below, or by using the keyword search tool below to find specific information within the annual report.-
 1
1 -
2
-
3
-
4
-
5
-
6
-
 7
7 -
 8
8 -
 9
9 -
 10
10 -
 11
11 -
 12
12 -
 13
13 -
 14
14 -
 15
15 -
 16
16 -
 17
17 -
 18
18 -
 19
19 -
 20
20 -
 21
21 -
 22
22 -
 23
23 -
 24
24
 |
 |
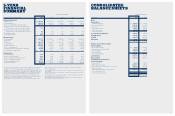
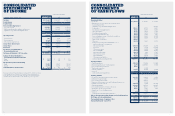
Basis of presentation: VF operates and reports using a 52/53 week fiscal year ending
on the Saturday closest to December 31 of each year. For presentation purposes
herein, all references to “2012”, “2011” and “2010” relate to the 52-week fiscal years
ended December 29, 2012, December 31, 2011, and January 1, 2011, respectively.
CONSOLIDATED
STATEMENTS
OF INCOME
YEAR ENDED DECEMBER
In thousands, except per share amounts 2012 2011 2010
Net Sales $ 10,766,020 $ 9,365,477 $ 7,624,599
Royalty Income 113,835 93,755 77,990
Total Revenues 10,879,855 9,459,232 7,702,589
Costs and Operating Expenses
Cost of goods sold 5,817,880 5,128,602 4,105,201
Marketing, administrative and general expenses 3,596,708 3,085,839 2,574,790
Impairment of goodwill and intangible assets – – 201,738
9,414,588 8,214,441 6,881,729
Operating Income 1,465,267 1,244,791 820,860
Interest income 3,353 4,778 2,336
Interest expense (93,605) (77,578) (77,738)
Other income (expense), net 46,860 (7,248) 4,754
Income Before Income Taxes 1,421,875 1,164,743 750,212
Income Taxes 335,737 274,350 176,700
Net Income 1,086,138 890,393 573,512
Net (Income) Loss Attributable to
Noncontrolling Interests (139) (2,304) (2,150)
Net Income Attributable to VF Corporation $ 1,085,999 $ 888,089 $ 571,362
Earnings Per Share Attributable to
VF Corporation Common Stockholders
Basic $ 9.89 $ 8.13 $ 5.25
Diluted 9.70 7.98 5.18
Weighted Average Shares Outstanding
Basic 109,823 109,287 108,764
Diluted 111,904 111,288 110,328
Cash Dividends Per Common Share $ 3.03 $ 2.61 $ 2.43
CONSOLIDATED
STATEMENTS
OF CASH FLOWS
YEAR ENDED DECEMBER
In thousands 2012 2011 2010
Operating Activities
Net income $ 1,086,138 $ 890,393 $ 573,512
Adjustments to reconcile net income to cash provided
by operating activities:
Impairment of goodwill and intangible assets – – 201,738
Depreciation 148,969 127,203 116,837
Amortization of intangible assets 47,929 41,708 39,373
Other amortization 41,058 29,824 17,186
Stock-based compensation 92,814 76,739 63,538
Provision for doubtful accounts 19,264 12,490 7,441
Pension funding in excess of (less than) contributions (20,198) 46,346 (45,850)
Deferred income taxes (20,797) (10,867) (92,068)
Gain on sale of businesses (44,485) – –
Other, net (40,931) 32,665 29,179
Changes in operating assets and liabilities, net of
purchases and sales of businesses:
Accounts receivable (111,571) (154,487) (12,954)
Inventories 87,620 (7,509) (114,334)
Other current assets 32,382 (18,449) (7,689)
Accounts payable (74,294) (32,898) 140,470
Accrued compensation (18,907) 2,448 27,817
Accrued income taxes 26,213 16,009 (14,649)
Accrued liabilities (17,005) (10,834) 50,889
Other assets and liabilities 40,801 40,590 20,846
Cash provided by operating activities 1,275,000 1,081,371 1,001,282
Investing Activities
Capital expenditures (251,940) (170,894) (111,640)
Business acquisitions, net of cash acquired (1,750) (2,207,065) (38,290)
Proceeds from sale of businesses 72,519 – –
Trademarks acquisition – (58,132) –
Software purchases (30,890) (20,102) (13,610)
Other, net (8,230) (3,840) (16,940)
Cash used by investing activities (220,291) (2,460,033) (180,480)
Financing Activities
Net increase (decrease) in short-term borrowings (269,010) 250,824 (9,741)
Payments on long-term debt (2,776) (2,738) (203,063)
Proceeds from long-term debt – 898,450 –
Payments of debt issuance costs and hedging settlement costs – (55,536) –
Purchases of Common Stock (307,282) (7,420) (411,838)
Cash dividends paid (333,229) (285,722) (264,281)
Proceeds from issuance of Common Stock, net 62,770 134,012 137,732
Tax benefits of stock option exercises 47,213 33,153 8,599
Acquisitions of noncontrolling interests – (52,440) –
Other, net (201) (338) (240)
Cash provided (used) by financing activities (802,515) 912,245 (742,832)
Effect of Foreign Currency Rate Changes on Cash and Equivalents 4,039 15,406 (17,280)
Net Change in Cash and Equivalents 256,233 (451,011) 60,690
Cash and Equivalents — Beginning of Year 341,228 792,239 731,549
Cash and Equivalents — End of Year $ 597,461 $ 341,228 $ 792,239
32 33