North Face 2012 Annual Report Download - page 16
Download and view the complete annual report
Please find page 16 of the 2012 North Face annual report below. You can navigate through the pages in the report by either clicking on the pages listed below, or by using the keyword search tool below to find specific information within the annual report.-
 1
1 -
2
-
3
-
4
-
5
-
 6
6 -
 7
7 -
 8
8 -
 9
9 -
 10
10 -
 11
11 -
 12
12 -
 13
13 -
 14
14 -
 15
15 -
 16
16 -
 17
17 -
 18
18 -
 19
19 -
 20
20 -
 21
21 -
 22
22 -
 23
23 -
 24
24
 |
 |
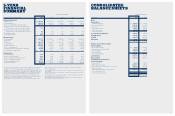
CONSOLIDATED
BALANCE SHEETS
YEAR ENDED DECEMBER
In thousands 2012 2011
Assets
Current Assets
Cash and equivalents $ 597,461 $ 341,228
Accounts receivable, net 1,222,345 1,120,246
Inventories 1,354,158 1,453,645
Deferred income taxes 140,515 106,717
Other current assets 135,104 166,108
Total current assets 3,449,583 3,187,944
Property, Plant and Equipment 828,218 737,451
Intangible Assets 2,917,058 2,958,463
Goodwill 2,009,757 2,023,460
Other Assets 428,405 405,808
$ 9,633,021 $ 9,313,126
Liabilities and Stockholders’ Equity
Current Liabilities
Short-term borrowings $ 12,559 $ 281,686
Current portion of long-term debt 402,873 2,744
Accounts payable 562,638 637,116
Accrued liabilities 754,142 744,486
Total current liabilities 1,732,212 1,666,032
Long-term Debt 1,429,166 1,831,781
Other Liabilities 1,346,018 1,290,138
Commitments and Contingencies
Stockholders’ Equity
Common Stock 110,205 110,557
Additional paid-in capital 2,527,868 2,316,107
Accumulated other comprehensive income (loss) (453,895) (421,477)
Retained earnings 2,941,447 2,520,804
Total equity attributable to VF Corporation 5,125,625 4,525,991
Noncontrolling interests – (816)
Total stockholders' equity 5,125,625 4,525,175
$ 9,633,021 $ 9,313,126
1 Operating results for 2010 include a noncash charge for impairment of goodwill and
intangible assets — $201.7 million (pretax) in operating income and $141.8 million
(after tax) in net income attributable to VF Corporation, $1.30 basic earnings per share
and $1.29 diluted earnings per share. Operating results for 2009 include a noncash
charge for impairment of goodwill and intangible assets — $122.0 million (pretax) in
operating income and $114.4 million (after tax) in net income attributable to VF
Corporation, $1.04 basic earnings per share and $1.03 diluted earnings per share.
2 Dividends per share divided by earnings per diluted share (excluding the charge for
impairment of goodwill and intangible assets in 2010 and 2009).
3 Total capital is defined as stockholders’ equity plus short-term and long-term debt.
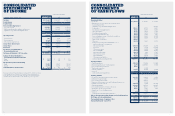
5-YEAR
FINANCIAL
SUMMARY
YEAR ENDED DECEMBER
In thousands, except per share amounts 20128 20118 2010 2009 2008
Summary of Operations 1
Total revenues $ 10,879,855 $ 9,459,232 $ 7,702,589 $ 7,220,286 $ 7,642,600
Operating income 1,465,267 1,244,791 820,860 736,817 938,995
Net income attributable to VF Corporation 1,085,999 888,089 571,362 461,271 602,748
Earnings (loss) per common share attributable to
VF Corporation common stockholders — basic 9.89 8.13 5.25 4.18 5.52
Earnings (loss) per common share attributable to
VF Corporation common stockholders — diluted 9.70 7.98 5.18 4.13 5.42
Dividends per share 3.03 2.61 2.43 2.37 2.33
Dividend payout ratio 2,7 31.2% 32.7% 37.6% 46.0% 43.0%
Financial Position
Working capital $ 1,717,371 $ 1,521,912 $ 1,716,585 $ 1,536,773 $ 1,640,828
Current ratio 2.0 1.9 2.5 2.4 2.6
Total assets $ 9,633,021 $ 9,313,126 $ 6,457,556 $ 6,473,863 $ 6,433,868
Long-term debt 1,429,166 1,831,781 935,882 938,494 1,141,546
Stockholders’ equity 5,125,625 4,525,175 3,861,319 3,813,285 3,557,245
Debt to total capital ratio 3 26.5% 31.9% 20.2% 23.7% 25.2%
Weighted average common shares outstanding 109,823 109,287 108,764 110,389 109,234
Book value per common share $ 46.51 $ 40.93 $ 35.77 $ 34.58 $ 32.37
Other Statistics 4
Operating margin 7 13.5% 13.2% 13.3% 11.9% 12.3%
Return on invested capital 5,6,7 16.2% 15.8% 15.6% 12.6% 13.5%
Return on average stockholders’ equity 6,7 24.7% 22.0% 20.1% 17.2% 18.2%
Return on average total assets 6,7 11.9% 11.9% 11.8% 9.6% 10.0%
Cash provided by operations $ 1,275,000 $ 1,081,371 $ 1,001,282 $ 973,485 $ 679,472
Cash dividends paid 333,229 285,722 264,281 261,682 255,235
4 Operating statistics exclude the charges for impairment of goodwill and intangible
assets in 2010 and 2009.
5 Invested capital is defined as average stockholders’ equity plus average short-term and
long-term debt.
6 Return is defined as net income attributable to VF Corporation plus total interest income/
expense, net of taxes.
7 Information presented for 2010 and 2009 excludes the impairment charges for goodwill
and intangible assets as discussed in (1) above.
8 The Timberland Company was purchased on September 13, 2011, and its results have
been included since the date of acquisition.
30 31