North Face 2010 Annual Report Download - page 2
Download and view the complete annual report
Please find page 2 of the 2010 North Face annual report below. You can navigate through the pages in the report by either clicking on the pages listed below, or by using the keyword search tool below to find specific information within the annual report.-
 1
1 -
 2
2 -
 3
3 -
 4
4 -
 5
5 -
 6
6 -
 7
7 -
 8
8 -
 9
9 -
 10
10 -
 11
11 -
 12
12 -
 13
13 -
14
-
15
-
16
-
17
-
18
-
19
-
20
-
21
-
22
-
23
-
24
-
25
-
26
-
27
-
28
-
29
-
30
-
31
 |
 |

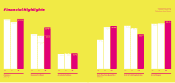
*Includes $.30 per share in
expenses to reduce costs
**Excludes impairment charges
$973 $1,001
$678
08 09 10
Cash Flow from Operations
(Millions)
23.7%
20.2%
25.2%
08 09 10
Debt to Total Capital Ratio
46.7%
44.3%
43.9%
08 09 10
Gross Margins
1
$7,220
08 09 10
$7,703
$7,643
Revenues
(Millions)
$5.42*
$5.16**
$4.13
$6.46**
$5.18
08 09 10
Earnings Per Share
$2.37 $2.43
$2.33
08 09 10
Dividends Per Share
Financial Highlights