Nikon 2005 Annual Report Download - page 3
Download and view the complete annual report
Please find page 3 of the 2005 Nikon annual report below. You can navigate through the pages in the report by either clicking on the pages listed below, or by using the keyword search tool below to find specific information within the annual report.-
 1
1 -
 2
2 -
 3
3 -
 4
4 -
 5
5 -
 6
6 -
 7
7 -
 8
8 -
 9
9 -
 10
10 -
 11
11 -
 12
12 -
 13
13 -
 14
14 -
15
-
16
-
17
-
18
-
19
-
20
-
21
-
22
-
23
-
24
-
25
-
26
-
27
-
28
-
29
-
30
-
31
-
32
-
33
-
34
-
35
-
36
-
37
-
38
-
39
-
40
-
41
-
42
-
43
-
44
-
45
-
46
-
47
-
48
-
49
-
50
 |
 |

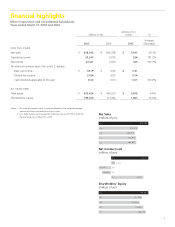
Net Sales
(millions of yen)
638,468
05
506,378
04
468,959
03
482,975
02
483,957
01
Net Income (Loss)
(millions of yen)
24,141
05
2,410
04
(8,143 ) 03
(6,004) 02
20,911
01
Shareholders’ Equity
(millions of yen)
01 186,119
05 196,030
04 171,194
02 176,961
03 162,464
Millions of Yen
Millions of U.S.
Dollars %
2005 2004 2005
Increase
(Decrease)
FOR THE YEAR
Net sales ¥ 638,468 ¥506,378$5,945 26.1%
Operating income 30,545 3,675 284 731.2%
Net income 24,141 2,410 224 901.7%
Per share of common stock (Yen and U.S. dollars):
Basic net income ¥ 65.19 ¥6.52$0.61
Diluted net income 57.84 6.02 0.54
Cash dividends applicable to the year 8.00 4.00 0.07 100.0%
AT YEAR-END
Total assets ¥ 633,426 ¥606,513 $5,898 4.4%
Shareholders’ equity 196,030 171,194 1,825 14.5%
Notes: 1. Per share of common stock is computed based on the weighted average
number of shares outstanding during the year.
2. U.S. dollar fi gures are translated for reference only at ¥107.39 to US$1.00,
the exchange rate at March 31, 2005.
fi nancial highlights
Nikon Corporation and Consolidated Subsidiaries
Years ended March 31, 2005 and 2004
1