Nikon 2002 Annual Report Download - page 3
Download and view the complete annual report
Please find page 3 of the 2002 Nikon annual report below. You can navigate through the pages in the report by either clicking on the pages listed below, or by using the keyword search tool below to find specific information within the annual report.-
 1
1 -
 2
2 -
 3
3 -
 4
4 -
 5
5 -
 6
6 -
 7
7 -
 8
8 -
 9
9 -
 10
10 -
 11
11 -
 12
12 -
 13
13 -
 14
14 -
15
-
16
-
17
-
18
-
19
-
20
-
21
-
22
-
23
-
24
-
25
-
26
-
27
-
28
-
29
-
30
-
31
-
32
-
33
-
34
-
35
-
36
-
37
-
38
-
39
-
40
-
41
-
42
 |
 |

01
¥ 482,975
22,239
(6,004 )
(16.23 )
4.00
¥ 561,276
176,961
¥ 483,957
61,423
20,911
56.53
8.00
¥ 593,454
186,119
$ 3,625
167
(45 )
(0.12 )
0.03
$ 4,212
1,328
(0.2%)
(50.0%)
(5.4%)
(4.9%)
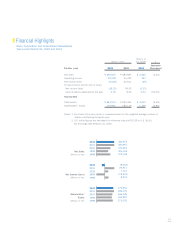
Total assets
Shareholders' equity
Net sales
Operating income
Net income (loss)
Per share of common stock (Yen and U.S. dollars):
Net income (loss)
Cash dividends applicable to the year
At year-end
For the year
(6,004 )
20,911
7,770
(18,233 )
8,318
176,961
186,119
166,495
160,991
171,051
2002
2001
2000
1999
1998
2002
2001
2000
1999
1998
2002
2001
2000
1999
1998
482,975
483,957
371,801
305,765
372,146
Net Sales
(Millions of Yen)
Net Income (Loss)
(Millions of Yen)
Shareholders'
Equity
(Millions of Yen)
Millions of Yen
Millions of
U.S. Dollars %
2002 2001 2002
Increase
(Decrease)
Notes: 1. Per share of common stock is computed based on the weighted average number of
shares outstanding during the year.
2. U.S. dollar figures are translated for reference only at ¥133.25 to U.S. $1.00,
the exchange rate at March 31, 2002.
Financial Highlights
Nikon Corporation and Consolidated Subsidiaries
Years ended March 31, 2002 and 2001