Nikon 2002 Annual Report Download - page 16
Download and view the complete annual report
Please find page 16 of the 2002 Nikon annual report below. You can navigate through the pages in the report by either clicking on the pages listed below, or by using the keyword search tool below to find specific information within the annual report.-
 1
1 -
2
-
3
-
4
-
5
-
 6
6 -
 7
7 -
 8
8 -
 9
9 -
 10
10 -
 11
11 -
 12
12 -
 13
13 -
 14
14 -
 15
15 -
 16
16 -
 17
17 -
 18
18 -
 19
19 -
 20
20 -
 21
21 -
 22
22 -
 23
23 -
 24
24 -
 25
25 -
 26
26 -
27
-
28
-
29
-
30
-
31
-
32
-
33
-
34
-
35
-
36
-
37
-
38
-
39
-
40
-
41
-
42
 |
 |

14
OPERATIONAL REVIEW AND ANALYSIS
During the year, the Nikon Group worked to further promote its in-house company system. Together with an enhanced focus on consolidated man-
agement of operations within each company, this helped to fortify the Group earnings structure. Efforts focused on providing products and services
to deliver customer satisfaction, on reducing costs as far as possible, and on squeezing inventories and trade receivables. However, the sheer
scale of the downturn in the semiconductor market–the most severe ever recorded historically–inevitably had a strongly negative impact on the
Nikon Group business. Consolidated net sales totaled ¥483.0 billion, a decline of ¥1.0 billion, or 0.2%, relative to the previous year. Nikon record-
ed a consolidated net loss of ¥6.0 billion.
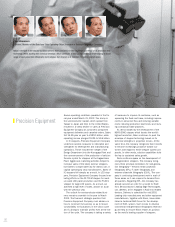
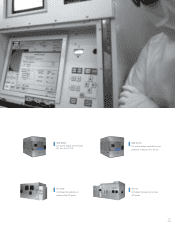
Breaking down the results by business segment, Precision Equipment posted ¥199.0 billion in net sales, a decrease of 15.3%, and ¥3.6 bil-
lion in operating income. Although sales of LCD steppers remained roughly on a par with the previous year, sales of IC steppers fell sharply as
semiconductor manufacturers made huge cuts in their capital spending budgets. Imaging Products benefited from continued growth in the digital
camera market, posting an increase in net sales of 23.0% to ¥221.6 billion, alongside operating income of ¥16.1 billion. Instruments recorded net
sales of ¥46.6 billion, a 21.0% decrease relative to the previous year, principally as a result of poor sales of industrial microscopes. Operating
profit for the segment amounted to ¥0.5 billion.
In Japan, Imaging Products successfully boosted its sales as a result of ongoing expansion in the digital camera market. Meanwhile Precision
Equipment and Instruments deteriorated markedly as the sudden fall-off in demand within the semiconductor market led to major reductions in lev-
els of capital investment by semiconductor manufacturers. As a result, total sales in Japan decreased by 11.7% to ¥374.5 billion,while operating
income amounted to ¥5.7 billion.
In contrast, results in overseas markets improved. In North America, steady growth in the digital camera market combined with sales of IC
steppers that held up relatively well. Overall, sales rose 42.6% to ¥205.8 billion, producing operating income of ¥6.9 billion. In Europe, although
sales of IC steppers declined, this was offset by higher sales of digital cameras as Nikon launched new products into a growing market. In Europe,
sales grew by 7.4% to ¥83.4 billion, although operating income dipped to ¥2.3 billion. In Asia, Nikon boosted production capacity at existing manu-
facturing bases within Imaging Products. The initiation of direct sales operations in Singapore and Malaysia made a significant contribution to
sales growth. Overall, regional sales rose 59.7% to ¥39.9 billion, generating operating income of ¥2.9 billion.
Income Analysis
Years ended March 31, 2002 and 2001
(% of Net Sales)
2002 2001
Net sales 100.0% 100.0%
Cost of sales (63.5) (62.4)
Gross profit 36.5 37.6
SG&A expenses (31.9) (24.9)
Operating income 4.6 12.7
Net interest expense and dividend income (0.5) (0.6)
Net other income (expenses) (3.5) (5.9)
Income before income taxes and minority interest 0.6 6.2
Income taxes (1.8) (1.9)
Minority interest (0.0) (0.0)
Net income (loss) (1.2) 4.3
Note: All expenses and subtractive amounts are in parentheses.
Balance Sheet Analysis
March 31, 2002 and 2001
(% of Total Assets)
2002 2001
Total assets 100.0% 100.0%
Total current assets 65.5 70.1
Inventories 37.1 33.7
Property, plant and equipment 20.2 16.5
Investments and other assets 14.3 13.4
Total current liabilities 50.0 54.5
Short-term borrowings 19.9 14.0
Long-term debt, less current portion 14.5 12.1
Shareholders’ equity 31.5 31.4