Neiman Marcus 2011 Annual Report Download - page 159
Download and view the complete annual report
Please find page 159 of the 2011 Neiman Marcus annual report below. You can navigate through the pages in the report by either clicking on the pages listed below, or by using the keyword search tool below to find specific information within the annual report.-
 1
1 -
2
-
3
-
4
-
5
-
6
-
7
-
8
-
9
-
10
-
11
-
12
-
13
-
14
-
15
-
16
-
17
-
18
-
19
-
20
-
21
-
22
-
23
-
24
-
25
-
26
-
27
-
28
-
29
-
30
-
31
-
32
-
33
-
34
-
35
-
36
-
37
-
38
-
39
-
40
-
41
-
42
-
43
-
44
-
45
-
46
-
47
-
48
-
49
-
50
-
51
-
52
-
53
-
54
-
55
-
56
-
57
-
58
-
59
-
60
-
61
-
62
-
63
-
64
-
65
-
66
-
67
-
68
-
69
-
70
-
71
-
72
-
73
-
74
-
75
-
76
-
77
-
78
-
79
-
80
-
81
-
82
-
83
-
84
-
85
-
86
-
87
-
88
-
89
-
90
-
91
-
92
-
93
-
94
-
95
-
96
-
97
-
98
-
99
-
100
-
101
-
102
-
103
-
104
-
105
-
106
-
107
-
108
-
109
-
110
-
111
-
112
-
113
-
114
-
115
-
116
-
117
-
118
-
119
-
120
-
121
-
122
-
123
-
124
-
125
-
126
-
127
-
128
-
129
-
130
-
131
-
132
-
133
-
134
-
135
-
136
-
137
-
138
-
139
-
140
-
141
-
142
-
143
-
144
-
145
-
146
-
147
-
148
-
 149
149 -
 150
150 -
 151
151 -
 152
152 -
 153
153 -
 154
154 -
 155
155 -
 156
156 -
 157
157 -
 158
158 -
 159
159 -
 160
160 -
 161
161 -
 162
162 -
 163
163 -
 164
164 -
 165
165
 |
 |
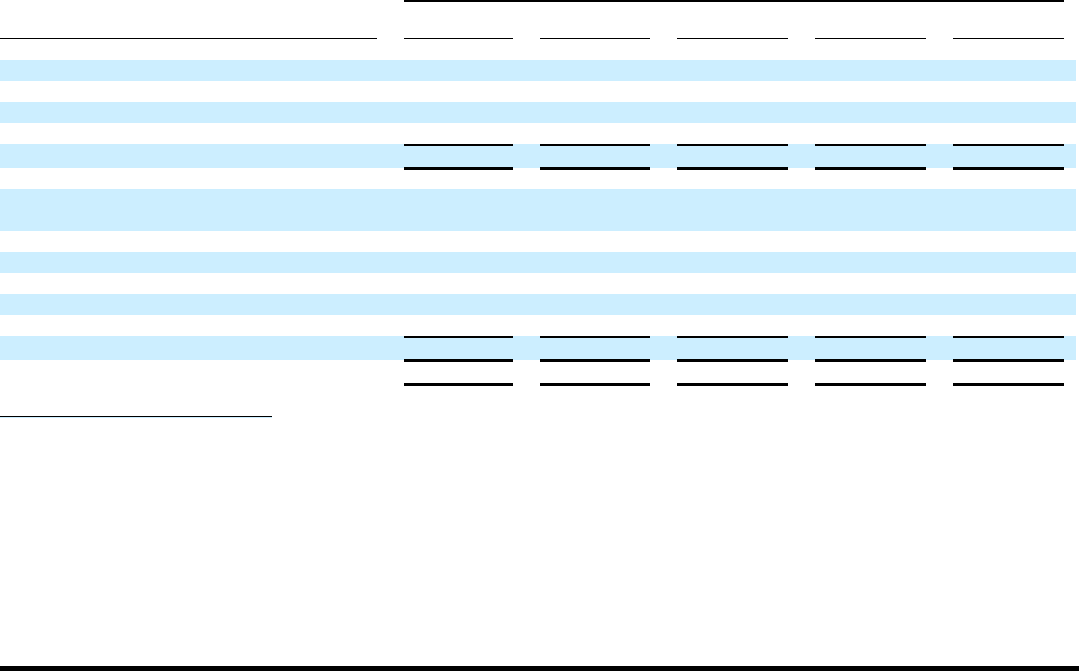
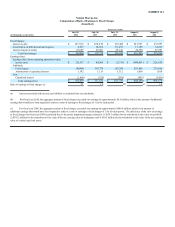
EXHIBIT 12.1
Neiman Marcus, Inc.
Computation of Ratio of Earnings to Fixed Charges
(Unaudited)
Fiscal year ended
(in thousands, except ratios)
July 28,
2012
July 30,
2011
July 31,
2010
August 1,
2009
August 2,
2008
Fixed Charges:
Interest on debt $167,916 $266,816 $219,400 $221,951 $233,557
Amortization of debt discount and expense 8,457 14,661 18,697 17,185 14,217
Interest element of rentals 27,687 26,301 25,146 24,750 27,291
Total fixed charges $204,060 $307,778 $263,243 $263,886 $275,065
Earnings (loss):
Earnings (loss) from continuing operations before
income taxes $228,337 $49,264 $(5,313) $ (888,491) $ 226,629
Add back:
Fixed charges 204,060 307,778 263,243 263,886 275,065
Amortization of capitalized interest 1,142 1,115 1,112 1,058 1,018
Less:
Capitalized interest (1,080) (535) (286) (993) (3,036)
Total earnings (loss) $ 432,459 $ 357,622 $258,756 $(624,540) $ 499,676
Ratio of earnings to fixed charges (a) 2.1 1.2 (b) (c) 1.8
(a) Interest associated with income tax liabilities is excluded from our calculation.
(b) For fiscal year 2010, the aggregate amount of fixed charges exceeded our earnings by approximately $4.5 million, which is the amount of additional
earnings that would have been required to achieve a ratio of earnings to fixed charges of 1.0x for such period.
(c) For fiscal year 2009, the aggregate amount of fixed charges exceeded our earnings by approximately $888.4 million, which is the amount of
additional earnings that would have been required to achieve a ratio of earnings to fixed charges of 1.0x for such period. The deficiency of the ratio of earnings
to fixed charges for fiscal year 2009 is primarily due to the pretax impairment charges related to 1) $329.7 million for the writedown to fair value of goodwill,
2) $343.2 million for the writedown to fair value of the net carrying value of tradenames and 3) $30.3 million for the writedown to fair value of the net carrying
value of certain long-lived assets.