Neiman Marcus 2011 Annual Report Download - page 135

Download and view the complete annual report

Please find page 135 of the 2011 Neiman Marcus annual report below. You can navigate through the pages in the report by either clicking on the pages listed below, or by using the keyword search tool below to find specific information within the annual report.

Page out of 165

  • 1
  • 2
  • 3
  • 4
  • 5
  • 6
  • 7
  • 8
  • 9
  • 10
  • 11
  • 12
  • 13
  • 14
  • 15
  • 16
  • 17
  • 18
  • 19
  • 20
  • 21
  • 22
  • 23
  • 24
  • 25
  • 26
  • 27
  • 28
  • 29
  • 30
  • 31
  • 32
  • 33
  • 34
  • 35
  • 36
  • 37
  • 38
  • 39
  • 40
  • 41
  • 42
  • 43
  • 44
  • 45
  • 46
  • 47
  • 48
  • 49
  • 50
  • 51
  • 52
  • 53
  • 54
  • 55
  • 56
  • 57
  • 58
  • 59
  • 60
  • 61
  • 62
  • 63
  • 64
  • 65
  • 66
  • 67
  • 68
  • 69
  • 70
  • 71
  • 72
  • 73
  • 74
  • 75
  • 76
  • 77
  • 78
  • 79
  • 80
  • 81
  • 82
  • 83
  • 84
  • 85
  • 86
  • 87
  • 88
  • 89
  • 90
  • 91
  • 92
  • 93
  • 94
  • 95
  • 96
  • 97
  • 98
  • 99
  • 100
  • 101
  • 102
  • 103
  • 104
  • 105
  • 106
  • 107
  • 108
  • 109
  • 110
  • 111
  • 112
  • 113
  • 114
  • 115
  • 116
  • 117
  • 118
  • 119
  • 120
  • 121
  • 122
  • 123
  • 124
  • 125
  • 126
  • 127
  • 128
  • 129
  • 130
  • 131
  • 132
  • 133
  • 134
  • 135
  • 136
  • 137
  • 138
  • 139
  • 140
  • 141
  • 142
  • 143
  • 144
  • 145
  • 146
  • 147
  • 148
  • 149
  • 150
  • 151
  • 152
  • 153
  • 154
  • 155
  • 156
  • 157
  • 158
  • 159
  • 160
  • 161
  • 162
  • 163
  • 164
  • 165


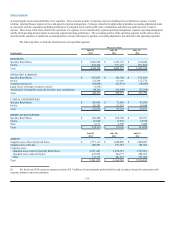
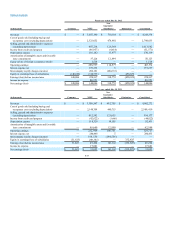
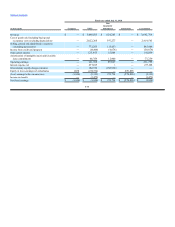
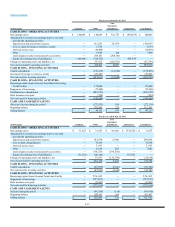
Fiscal year ended July 31, 2010
(in thousands) Company NMG
Non-
Guarantor
Subsidiaries Eliminations Consolidated
CASH FLOWS - OPERATING ACTIVITIES
        
 

  
   
  
   
   
   
    
    
CASH FLOWS - INVESTING ACTIVITIES
 
  
CASH FLOWS - FINANCING ACTIVITIES
  
 
CASH AND CASH EQUIVALENTS
   
  
       
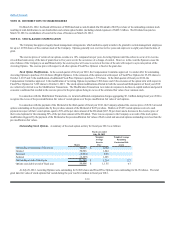
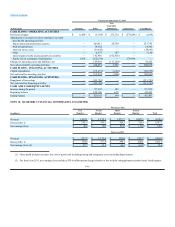
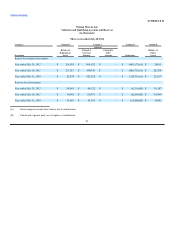
NOTE 18. QUARTERLY FINANCIAL INFORMATION (UNAUDITED)
Fiscal year 2012
(in millions)
First
Quarter
Second
Quarter
Third
Quarter
Fourth
Quarter Total
     
       
    
Fiscal year 2011
    
      
       
      


