Napa Auto Parts 2006 Annual Report Download - page 19
Download and view the complete annual report
Please find page 19 of the 2006 Napa Auto Parts annual report below. You can navigate through the pages in the report by either clicking on the pages listed below, or by using the keyword search tool below to find specific information within the annual report.-
 1
1 -
2
-
3
-
4
-
5
-
6
-
7
-
8
-
 9
9 -
 10
10 -
 11
11 -
 12
12 -
 13
13 -
 14
14 -
 15
15 -
 16
16 -
 17
17 -
 18
18 -
 19
19 -
 20
20 -
 21
21 -
 22
22 -
 23
23 -
 24
24 -
 25
25 -
 26
26 -
 27
27 -
 28
28 -
 29
29 -
30
-
31
-
32
-
33
-
34
-
35
-
36
-
37
-
38
-
39
-
40
-
41
-
42
-
43
-
44
-
45
-
46
-
47
-
48
 |
 |
Automotive sales were $5.0 billion in 2005, an increase of 6%
over 2004. Among the quarters in 2005, sales increases over the
same period of the prior year ranged from an increase of 4% in
the rst quarter to 8% in the third quarter, our strongest period
for the year. The continued effectiveness of our growth initiatives
in this group, as well as positive industry trends, helped produce
these results. As in 2006, stronger growth in our core NAPA
operations was offset by a decrease in sales at Johnson Industries,
where we sold eight of twelve operations during 2005.
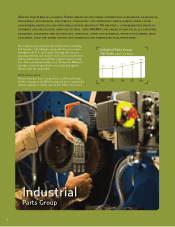
Industrial Group
Net sales for Motion Industries, our Industrial Group (“Industrial”),
were $3.1 billion in 2006, an increase of 11% compared to 2005,
and our third consecutive year of 11% sales growth. In 2006, this
group recorded steady progress throughout the year, with double-
digit growth in each quarter. Industrial expanded its distribution
network during the year by opening 10 new locations and by
adding another 31 locations via two acquisitions. U.S. industrial
production and capacity utilization indices also showed continued
strength for the manufacturing sector in 2006, and based on
current indices, the outlook remains positive for this sector in 2007.
Net sales in 2005 were $2.8 billion, an 11% increase compared
to 2004. In 2005, this group had double-digit growth in each
quarter except in the fourth quarter when sales increased 9%.
Over the three-year period ended December 31, 2006, Industrial
has beneted from a combination of price increases common in
the industry as well as stronger sales volume.
Ofce Group
Net sales for S.P. Richards, our Ofce Products Group (“Ofce”),
were $1.8 billion, an increase of 7% compared to the prior year.
Among our business groups, Ofce is our most steady performer
from year to year, and in 2006, product and customer expansion
efforts and the continued development of effective marketing
programs and dealer services helped to drive this group’s progress.
Although its rate of sales growth decreased during the year, we
were encouraged by the Ofce group’s performance in 2006.
Sales increased by 13% in the rst quarter, 6% in the second
quarter, 5% in the third quarter and 4% in the fourth quarter.
Net sales in 2005 were $1.7 billion, up 8% over 2004. This repre-
sents a solid increase for the Ofce group and reects the success
of its ongoing business expansion strategy. Among the quarters,
revenues grew stronger over the year, with sales increasing 6% in
the rst quarter, 8% in the second and third quarters and 10%
in the fourth quarter.
Electrical Group
Net sales for EIS, our Electrical and Electronic Group (“Electrical”),
increased by 20% to $408 million in 2006. The strong performance
at Electrical reects the continued manufacturing expansion in the
U.S., as well as this group’s commitment to ongoing sales initia-
tives. In 2006, Electrical completed phase one of a sales process
restructuring program developed to improve customer contact and
maximize customer growth. For the year, sales were up 13% in the
rst quarter, 24% in the second quarter, 23% in the third quarter
and 17% in the fourth quarter.
Net sales were up 2% to $342 million in 2005. Electrical’s strongest
performance was in the fourth quarter, after generally at results
over the rst three quarters of the year. EIS sold its Circuit Supply
division in April of 2005, which impacted its overall growth rate.
The ongoing Electrical operations were up 9% for the year,
reecting the continued strength in the manufacturing sector,
which began to show improvement late in 2003.
Cost of Goods Sold
Cost of goods sold was $7.2 billion and $6.7 billion in 2006 and
2005, respectively, representing 68.7% of net sales in both years.
After improving gross margins in each of the previous two years,
our ongoing gross margin growth initiatives were offset in 2006 by
increasing competitive pricing pressures in the markets we serve.
Our initiatives to enhance our pricing strategies, promote and sell
higher margin products, and minimize material acquisition costs
lessened the effect of these negative margin pressures in 2006.
Cost of goods sold in 2005 was $6.7 billion or 68.7% of net sales
compared to $6.3 billion or 68.9% in 2004. The decrease in cost
of goods sold as a percent of net sales reects the success of our
initiatives implemented to improve gross margins. These initiatives
were initially developed to offset the usual competitive pricing
pressures as well as lower levels of vendor discounts and volume
incentives earned over the prior few years, especially in Industrial.
Each of our business segments also experienced vendor price
increases in 2005, and by working with our customers we were
able to pass some of these along to them, particularly in Industrial.
17