Napa Auto Parts 2006 Annual Report Download - page 18
Download and view the complete annual report
Please find page 18 of the 2006 Napa Auto Parts annual report below. You can navigate through the pages in the report by either clicking on the pages listed below, or by using the keyword search tool below to find specific information within the annual report.-
 1
1 -
2
-
3
-
4
-
5
-
6
-
7
-
 8
8 -
 9
9 -
 10
10 -
 11
11 -
 12
12 -
 13
13 -
 14
14 -
 15
15 -
 16
16 -
 17
17 -
 18
18 -
 19
19 -
 20
20 -
 21
21 -
 22
22 -
 23
23 -
 24
24 -
 25
25 -
 26
26 -
 27
27 -
 28
28 -
29
-
30
-
31
-
32
-
33
-
34
-
35
-
36
-
37
-
38
-
39
-
40
-
41
-
42
-
43
-
44
-
45
-
46
-
47
-
48
 |
 |

Management’s Discussion and Analysis of Financial Condition and Results of Operations
2006
Overview
Genuine Parts Company is a service organization engaged in the
distribution of automotive replacement parts, industrial replace-
ment parts, ofce products and electrical/electronic materials.
The Company has a long tradition of growth dating back to 1928,
the year we were founded in Atlanta, Georgia. We have increased
sales in 56 of the last 57 years and increased prots in 44 of the
last 46 years. In 2006, business was conducted throughout the
United States, in Puerto Rico, in Canada and in Mexico from
approximately 2,000 locations.
We recorded consolidated net sales of $10.5 billion for the year
ended December 31, 2006, an increase of 7% compared to
$9.8 billion in 2005. Consolidated net income for the year ended
December 31, 2006, was $475 million, up 9% from $437 million
in 2005. The combination of ongoing healthy economic conditions,
strong end markets and effective internal initiatives provided
us the opportunity to achieve another record level of sales and
earnings in 2006. All four business segments contributed to
our progress for the year, with each showing gains in revenues
and prots.
Our progress in 2006 follows 8% increases in revenues in both
2004 and 2005, and represents the third consecutive year of
double-digit growth in earnings per share. During the three-year
period ended December 31, 2006, the Company implemented
a variety of growth initiatives, including the introduction of
new and expanded product lines, geographic expansion, sales to
new markets, enhanced customer marketing programs and cost
savings initiatives. Each of our business segments participated
in developing these initiatives, as discussed further below.
The major categories on the December 31, 2006 consolidated
balance sheet were relatively consistent with the December 31,
2005 balance sheet categories, subject to certain exceptions
explained below. Our cash balances decreased $53 million or 28%
from December 31, 2005, due primarily to cash used during the
year for increased working capital requirements and investments
in capital expenditures. Accounts receivable grew $41 million or
3%, which is less than our increase in revenues, and inventory
was up less than 1%. Accounts payable decreased $63 million
or 7% from the prior year, due primarily to the termination of
extended terms with certain suppliers during 2006, resulting in
the decrease in days payables outstanding. Total debt outstanding
at December 31, 2006 was unchanged from December 31, 2005.
Results of Operations
Our results of operations are summarized for the three years
ended December 31, 2006, 2005 and 2004, as follows:
(in thousands, except
per share data)
Year ended December 31, 2006 2005 2004
Net Sales $ 10,457,942 $ 9,783,050 $ 9,097,267
Gross Profit 3,275,495 3,064,086 2,829,723
Net Income 475,405 437,434 395,552
Diluted Earnings
Per Share 2.76 2.50 2.25
Net Sales
Consolidated net sales for the year ended December 31, 2006
totaled $10.5 billion, another record sales level for the Company
and a 7% increase from 2005. Again in 2006, each of our four
business segments showed progress in revenues and contributed
to our overall sales growth. We attribute this improvement to
the ongoing good health of the national economy, strong end
markets and effective growth initiatives. For the year, prices
were up approximately 2% in the Automotive segment, 3% in the
Industrial and Ofce segments and 7% in the Electrical segment.
Net sales for the year ended December 31, 2005 totaled $9.8
billion, an 8% increase from 2004. Similar to 2006, all of the
business segments contributed to our sales growth in 2005, as
our internal initiatives, healthy economy and positive trends in
the industries we serve enhanced the sales volume in each of our
four groups. Prices were up approximately 2% in the Automotive
segment, 3% in the Ofce and Electrical segments and 6% in the
Industrial segment in 2005.
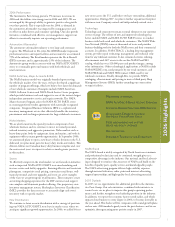
Automotive Group
Net sales for the Automotive Group (“Automotive”) increased by
3% to $5.2 billion in 2006. After achieving sales increases of 5%
in both the rst and second quarters, our sales growth slowed to
1% growth in the third quarter, followed by a 2% increase in the
fourth quarter. Automotives’ sales initiatives, including the addi-
tion of 64 net new NAPA AUTO PARTS stores and the continued
expansion of NAPA AutoCare programs, were somewhat impacted
by the effect of higher gasoline prices on vehicle miles driven and
aftermarket product demand. Both of these factors inuenced
our sales trends for the year. Additionally, our core NAPA sales
increase of 5% was offset by the sales decrease at Johnson
Industries, which was downsized in 2005.
16