Napa Auto Parts 2006 Annual Report Download - page 12
Download and view the complete annual report
Please find page 12 of the 2006 Napa Auto Parts annual report below. You can navigate through the pages in the report by either clicking on the pages listed below, or by using the keyword search tool below to find specific information within the annual report.-
 1
1 -
 2
2 -
 3
3 -
 4
4 -
 5
5 -
 6
6 -
 7
7 -
 8
8 -
 9
9 -
 10
10 -
 11
11 -
 12
12 -
 13
13 -
 14
14 -
 15
15 -
 16
16 -
 17
17 -
 18
18 -
 19
19 -
 20
20 -
 21
21 -
 22
22 -
23
-
24
-
25
-
26
-
27
-
28
-
29
-
30
-
31
-
32
-
33
-
34
-
35
-
36
-
37
-
38
-
39
-
40
-
41
-
42
-
43
-
44
-
45
-
46
-
47
-
48
 |
 |

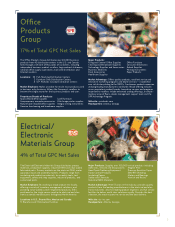
Office
Products Group
S.P. R C N A’ ,
40,000 U.S. C-
. T C
42 . O :
, , ,
, , , , ,
, .
e company’s comprehensive array of specialized services, logistical
capabilities and marketing programs create value for our customers,
including independent resellers, large contract stationers, national
offi ce supply superstores, mail order distributors and Internet resellers.
Our fulfi llment capabilities allow us to serve all types of resellers, even
those who operate a virtually stockless business model. In addition,
our national distribution network enables resellers in any part of the
country to serve their customers on a nationwide basis. By providing
convenient access to a broad range of quality products, excellent ser-
vice and innovative programs, we continue to provide our customers
with the tools they need to successfully grow their businesses.
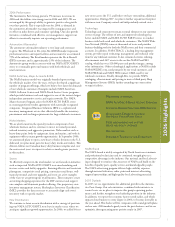
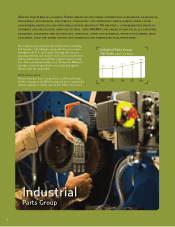
Office Products Group
Net Sales in billions of dollars
1.40
02 03 04 05 06
1.46 1.54 1.66 1.78
10