Napa Auto Parts 2005 Annual Report Download - page 19
Download and view the complete annual report
Please find page 19 of the 2005 Napa Auto Parts annual report below. You can navigate through the pages in the report by either clicking on the pages listed below, or by using the keyword search tool below to find specific information within the annual report.-
 1
1 -
2
-
3
-
4
-
5
-
6
-
7
-
8
-
 9
9 -
 10
10 -
 11
11 -
 12
12 -
 13
13 -
 14
14 -
 15
15 -
 16
16 -
 17
17 -
 18
18 -
 19
19 -
 20
20 -
 21
21 -
 22
22 -
 23
23 -
 24
24 -
 25
25 -
 26
26 -
 27
27 -
 28
28 -
 29
29 -
30
-
31
-
32
-
33
-
34
-
35
-
36
-
37
-
38
-
39
-
40
-
41
-
42
-
43
-
44
 |
 |

17
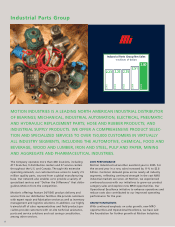
Net Income
Net income was $437 million in 2005, up 11% from $396 million
in 2004, and on a per share diluted basis, net income was
$2.50 in 2005 compared to $2.25 in 2004. Net income in 2005
was 4.5% of net sales compared to 4.3% in 2004.
Net income of $396 million in 2004 was up 12% from $354
million in 2003 before the cumulative effect of an accounting
change adopted January 1, 2003. On a per share diluted basis,
net income was $2.25 in 2004 compared to $2.03 in 2003 before
the cumulative effect adjustment. After the 2003 cumulative
effect adjustment, net income in 2004 was up 18% from
$334 million, or $1.91 diluted earnings per share in 2003.
Net income in 2004 was 4.3% of net sales compared to 4.2%
in 2003 before the cumulative effect adjustment, and 4.0%
of net sales in 2003 after the cumulative effect adjustment.
FINANCIAL CONDITION
The major consolidated balance sheet categories at December
31, 2005, with the exception of the accounts discussed below,
were relatively consistent with the December 31, 2004 balance
sheet categories. The Company’s cash balances increased
$54 million or 40% from December 31, 2004, primarily due to
improved operating results and improved payment terms with
certain vendors. Our accounts receivable balance at December
31, 2005 increased 6% compared to last year, primarily due to
our December sales increase. Inventory increased less than 1%
from December 31, 2004, reflecting our continued emphasis on
inventory management. Prepaid expenses and other current
assets increased $39 million or 22% from December 31, 2004,
reflecting the increase in receivables due from vendors. Other
assets at December 31, 2005 increased $125 million or 32% due
primarily to contributions to company sponsored defined benefit
plans. Accounts payable at December 31, 2005 increased $117
million or 14% from December 31, 2004 due to the Company’s
increased purchases associated with increased sales volume, as
well as improved payment terms with certain vendors.
LIQUIDITY AND CAPITAL RESOURCES
The ratio of current assets to current liabilities was 3.0 to 1 at
December 31, 2005, and the Company’s cash position improved
significantly from December 31, 2004. The Company had $501
million in total debt outstanding at December 31, 2005 and 2004.
Asummary of the Company’s statements of cash flows is
as follows:
Net Cash Provided by Operating Activities:
The Company continues to generate excellent cash flows, with
$441 million in cash from operations in 2005. Despite an increase
in net income in 2005, the 2005 operating cash flows decreased
from 2004 primarily due to an increase of $70 million in contri-
butions into company sponsored defined benefit plans. In
addition, the Company’s extended term negotiations and other
working capital improvements in 2004 were especially favorable
for operating cash flows in that year. This, as well as the growth
in net income in 2004 from 2003, also explains the increase in
cash from operations in 2004 compared to 2003. The Company
believes existing credit facilities and cash generated from oper-
ations will be sufficient to fund future operations, and to meet
its short-term and long-term cash requirements.
Net Cash Used in Investing Activities:
Cash flow used in investing activities was $70 million in 2005
and has remained relatively consistent for each of the three
years ending December 31, 2005, 2004 and 2003. In 2005, capital
expenditures were $86 million, and the Company expects capital
expenditures to approximate this level in the foreseeable future.
Net Cash Used in Financing Activities:
The Company used $317 million in financing activities in 2005,
primarily for dividends to shareholders and the repurchase
of the Company’s common stock. During 2004 and 2003, the
primary financing activities were the dividends and repayment
of borrowings. The Company paid dividends to shareholders
of $216 million, $209 million, and $205 million during 2005,
2004, and 2003, respectively.The Company expects this trend
of increasing dividends to continue in the foreseeable future.
While no borrowings were repaid in 2005, the Company repaid
variable rate borrowings of approximately $177 million and
$113 million in 2004 and 2003, respectively.Long-term debt of
$500 million at December 31, 2005 is comprised of two $250
million term notes with a consortium of financial and insurance
institutions due in 2008 and 2010. The Company does not
anticipate repaying these notes prior to their scheduled expira-
tion. During 2005, the Company repurchased $119 million in
Company stock as compared to repurchases of $21 million and
$18 million in 2004 and 2003, respectively. Weplan to remain
active in our share repurchase program, but the amount and
value of shares repurchased will vary annually.The increasing
dividends and fluctuations in cash used for the reduction of
debt and share repurchases primarily explain the changes in
cash used for financing activities in 2005, 2004 and 2003.
Notes and Other Borrowings
The Company maintains a $350 million unsecured revolving
line of credit with a consortium of financial institutions which
matures in October 2008 and bears interest at LIBOR plus .25%.
(4.61% at December 31, 2005). At December 31, 2005 and
2004, no amounts were outstanding under the line of credit.
At December 31, 2005, the Company had unsecured Senior
Notes outstanding under a $500 million financing arrangement
as follows: $250 million, Series A, 5.86% fixed, due 2008; and
$250 million, Series B, 6.23% fixed, due 2011 and approximately
$1 million in other borrowings. Certain borrowings contain
covenants related to a maximum debt-to-equity ratio, a
minimum fixed-charge coverage ratio, and certain limitations
on additional borrowings. At December 31, 2005, the Company
was in compliance with all such covenants. The weighted average
interest rate on the Company's outstanding borrowings was
approximately 6.05% at December 31, 2005 and 2004. Total
interest expense for all borrowings was $29.6 million and
$37.3 million in 2005 and 2004, respectively.
Year Ended December 31,
(in thousands) Percent Change
Net Cash Provided 2005 vs. 2004 vs.
by (Used in): 2005 2004 2003 2004 2003
Operating Activities $ 440,517 $ 555,236 $ 402,185 -21% 38%
Investing Activities (70,174) (67,955) (75,275) 3% -10%
Financing Activities (317,469) (369,328) (330,640) -14% 12%