Napa Auto Parts 2005 Annual Report Download - page 17
Download and view the complete annual report
Please find page 17 of the 2005 Napa Auto Parts annual report below. You can navigate through the pages in the report by either clicking on the pages listed below, or by using the keyword search tool below to find specific information within the annual report.-
 1
1 -
2
-
3
-
4
-
5
-
6
-
 7
7 -
 8
8 -
 9
9 -
 10
10 -
 11
11 -
 12
12 -
 13
13 -
 14
14 -
 15
15 -
 16
16 -
 17
17 -
 18
18 -
 19
19 -
 20
20 -
 21
21 -
 22
22 -
 23
23 -
 24
24 -
 25
25 -
 26
26 -
 27
27 -
28
-
29
-
30
-
31
-
32
-
33
-
34
-
35
-
36
-
37
-
38
-
39
-
40
-
41
-
42
-
43
-
44
 |
 |

15
Management's Discussion and Analysis of Financial Condition and Results of Operations
2005
OVERVIEW
Genuine Parts Company is a service organization engaged in the
distribution of automotive replacement parts, industrial replacement
parts, office products and electrical/electronic materials. The Company
has a long tradition of growth dating back to 1928, the year we
were founded in Atlanta, Georgia. In 2005, business was conducted
throughout the United States, in Canada and in Mexico from approxi-
mately 1,900 locations.
We recorded consolidated net income of $437 million for the year
ended December 31, 2005, up 11% from a record $396 million in
2004. The combination of a healthy national economy, positive trends
in the industries we serve and the success of our on-going internal
initiatives allowed us to achieve another record level of sales and
earnings in 2005. All four of our business segments contributed to
our achievement, with each showing gains in revenues and profits.
Our record results in 2004 and 2005 followed the challenge of operat-
ing in a slow economy over the three years preceding 2004. During
this period, the Company countered the economy’s negative impact
on our businesses by implementing a variety of programs, including
the introduction of new product lines, sales to new markets and cost
savings initiatives. As the economic conditions began to improve in
late 2003, we were well positioned for more growth in each of our
business segments.
During 2003, we recorded a charge to earnings as a result of a change
in accounting principle relating to cash consideration received from
vendors. The change, discussed further under “Net Income” below,
had no impact on our operating results and no cash implications
for us. Our results also depend on the effect of certain accounting
assumptions and estimates, which are discussed under “Critical
Accounting Estimates” below.
The major December 31, 2005 consolidated balance sheet categories,
with the exception of our improved cash position and accounts
payable balance, were relatively consistent with the December 31,
2004 balance sheet categories. The Company’scash balances increased
$54 million or 40% from December 31, 2004, due primarily to
improved operating results and improved payment terms with certain
vendors. These extended payment terms also explain our increase
in accounts payable. Accounts receivable grew 6%, which is less
than our increase in revenues, and inventory was up less than 1%.
Total debt outstanding at December 31, 2005 was unchanged from
December 31, 2004.
RESULTS OF OPERATIONS
The Company’s results of operations are summarized for the three
years ended December 31, 2005, 2004 and 2003.
Net Sales
Net sales for the year ended December 31, 2005 totaled $9.8 billion,
arecord sales level for the Company and an 8% increase from 2004.
All of the business segments contributed to our sales growth for the
year, as our internal initiatives, healthy economy and positive trends
in the industries we serve enhanced the sales volume in each of our
four groups. Prices were up approximately 2% in the Automotive
segment, 3% in the Office and Electrical segments and 6% in the
Industrial segment in 2005. Net sales for the year ended December
31, 2004 totaled $9.1 billion, an 8% increase from 2003. In 2004,
we experienced improved economic conditions relative to the prior
few years, and this favorably impacted the sales volume in each of
our four groups. In 2004, prices were up approximately 1% in the
Automotive, Office and Electrical segments, and pricing in the
Industrial segment increased 5%.
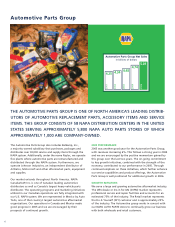
Automotive Group
Net sales for the Automotive Group (“Automotive”) were $5.0 billion
in 2005, an increase of 6% over 2004. Among the quarters, sales
increases over the same period of the prior year ranged from an
increase of 4% in the first quarter to 8% in the third quarter, our
strongest period for the year. The continued effectiveness of our
growth initiatives in this group, as well as positive industry trends,
helped produce these results. Stronger growth in our core NAPA
operations was offset by a decrease in sales at Johnson Industries,
where we sold eight of twelve operations during the year. Automotive
sales were $4.7 billion in 2004, an increase of 6% over 2003. The
2004 sales increase was due to factors which enhanced sales volume,
and this was Automotive’s largest percentage sales growth in several
years. We were pleased to match that level of increase in 2005.
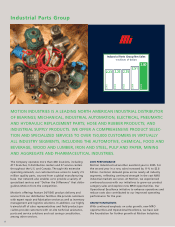
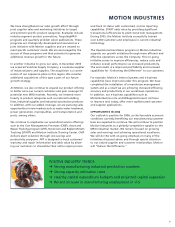
Industrial Group
Net sales for Motion Industries, our Industrial Group (“Industrial”),
were $2.8 billion in 2005, an 11% increase compared to 2004. Our
sales volume has been strong in the Industrial operations for the
past two years, and in 2005, this group had double-digit growth in
each quarter except in the fourth quarter when sales increased 9%.
U.S. industrial production and capacity utilization indices showed
continued strength for the manufacturing sector during the year,
and based on current indices, the outlook is positive for this sector
in 2006. Industrial sales were $2.5 billion in 2004, an 11% increase
over 2003. Improved economic conditions across our industrial
customer base in 2004 helped to significantly improve our growth
opportunities relative to the prior few years, when weak conditions
were pervasive in the markets served by Industrial. As a result, we
benefited from a combination of price increases common in the
industry as well as stronger sales volume.
Office Group
Net sales for S.P. Richards, our Office Products Group (“Office”),
were $1.7 billion, up 8% over 2004. This represents a solid increase
for the Office group and reflects the success of its product and
customer expansion strategy. Among the quarters, revenues grew
stronger over the year, with sales increasing 6% in the first quarter,
8% in the second and third quarters and 10% in the fourth quarter.
Office sales were $1.5 billion in 2004, up 6% over 2003. For 2004,
sales increases resulting from improved sales volume in the office
furniture category and at our Canadian operations helped lead
Office to its strongest growth in several years. We were pleased
to achieve even greater growth in 2005.
Electrical Group
Net sales for EIS, our Electrical and Electronic Group (“Electrical”), were
up 2% to $342 million in 2005. Electrical’sstrongest performance was
in the fourth quarter,after generally flat results over the first three
quarters of the year. EIS sold its Circuit Supply division in April of
2005, which impacted its overall growth rate. The ongoing Electrical
operations were up 9% for the year, reflecting the continued strength
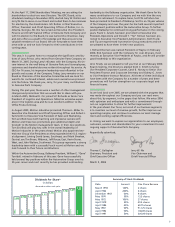
Year ended December 31, (in thousands, except per share data)
2005 2004 2003
Net Sales $ 9,783,050 $ 9,097,267 $ 8,449,300
Gross Profit 3,064,086 2,829,723 2,622,616
Income before
Cumulative Effect of a
Change in Accounting
Principle 437,434 395,552 353,642
Cumulative Effect of a
Change in Accounting
Principle —— (19,541)
Net Income 437,434 395,552 334,101
Diluted Earnings Per Share:
Before Change in
Accounting Principle 2.50 2.25 2.03
After Change in
Accounting Principle 2.50 2.25 1.91