NEC 2007 Annual Report Download - page 3
Download and view the complete annual report
Please find page 3 of the 2007 NEC annual report below. You can navigate through the pages in the report by either clicking on the pages listed below, or by using the keyword search tool below to find specific information within the annual report.-
 1
1 -
 2
2 -
 3
3 -
 4
4 -
 5
5 -
 6
6 -
 7
7 -
 8
8 -
 9
9 -
 10
10 -
 11
11 -
 12
12 -
 13
13 -
 14
14 -
15
-
16
-
17
-
18
-
19
-
20
-
21
-
22
-
23
-
24
-
25
-
26
-
27
-
28
-
29
-
30
-
31
-
32
-
33
-
34
-
35
-
36
-
37
-
38
-
39
-
40
-
41
-
42
-
43
-
44
-
45
-
46
-
47
-
48
-
49
-
50
-
51
-
52
-
53
-
54
-
55
-
56
-
57
-
58
-
59
-
60
-
61
-
62
-
63
-
64
-
65
-
66
-
67
-
68
-
69
-
70
-
71
-
72
-
73
-
74
-
75
-
76
-
77
-
78
-
79
-
80
-
81
-
82
-
83
-
84
-
85
-
86
-
87
-
88
-
89
-
90
-
91
-
92
-
93
-
94
-
95
-
96
-
97
-
98
-
99
-
100
-
101
-
102
-
103
-
104
-
105
-
106
-
107
-
108
-
109
-
110
-
111
-
112
-
113
-
114
-
115
-
116
-
117
-
118
-
119
-
120
 |
 |

2006 2007
0
1,000
2,000
3,000
4,000
5,000
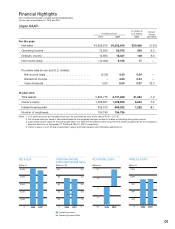
NET SALES
(Billion ¥)
NET INCOME (LOSS)
(Billion ¥)
OPERATING INCOME,
OPERATING INCOME RATIO
(Billion ¥, %)
OWNER’S EQUITY
(Billion ¥)
2006 2007
–10
–5
0
5
10
2006 2007
0
20
40
60
80
100
0
1.0
2.0
3.0
4.0
5.0
2006 2007
0
300
600
900
1,200
1,500
Financial Highlights
NEC CORPORATION AND CONSOLIDATED SUBSIDIARIES
For the years ended March 31, 2006 and 2007
(Japan GAAP)
In millions of
In millions of yen U.S. dollars
2006 2007 2007
For the year:
Net sales . . . . . . . . . . . . . . . . . . . . . . . . . . . . . . . . . . . . . . ¥4,929,970 ¥4,652,649 $39,429 –5.6%
Operating income . . . . . . . . . . . . . . . . . . . . . . . . . . . . . . . 72,526 69,976 593 –3.5
Ordinary income . . . . . . . . . . . . . . . . . . . . . . . . . . . . . . . . 14,955 16,347 139 9.3
Net income (loss) . . . . . . . . . . . . . . . . . . . . . . . . . . . . . . . . (10,062) 9,128 77 –
Per share data (in yen and U.S. dollars):
Net income (loss) . . . . . . . . . . . . . . . . . . . . . . . . . . . . . . (5.26) 4.43 0.04 –
Diluted net income . . . . . . . . . . . . . . . . . . . . . . . . . . . . . – 4.23 0.04 –
Cash dividends . . . . . . . . . . . . . . . . . . . . . . . . . . . . . . . 6.00 8.00 0.07 33.3
At year-end:
Total assets . . . . . . . . . . . . . . . . . . . . . . . . . . . . . . . . . . . . 3,802,775 3,731,669 31,624 –1.9
Owner’s equity . . . . . . . . . . . . . . . . . . . . . . . . . . . . . . . . . . 1,029,807 1,038,808 8,803 0.9
Interest-bearing debt . . . . . . . . . . . . . . . . . . . . . . . . . . . . . 935,103 859,292 7,282 –8.1
Number of employees . . . . . . . . . . . . . . . . . . . . . . . . . . . . 154,180 154,786
Notes: 1. U.S. dollar amounts are translated from yen, for convenience only, at the rate of ¥118 = U.S. $1.
2. Net income (loss) per share is calculated based on the weighted-average number of shares outstanding during each period.
3. Cash dividends per share for the year ended March 31, 2007 are the total of interim and year-end dividends approved by the Company’s
board of directors on November 21, 2006 and May 21, 2007, respectively.
4. Owner’s equity is sum of total shareholders’ equity and total valuation and translation adjustments.
Percent
change
2007/2006
Operating Income
Operating Income Ratio
01