Morgan Stanley 2004 Annual Report Download - page 7
Download and view the complete annual report
Please find page 7 of the 2004 Morgan Stanley annual report below. You can navigate through the pages in the report by either clicking on the pages listed below, or by using the keyword search tool below to find specific information within the annual report.-
 1
1 -
 2
2 -
 3
3 -
 4
4 -
 5
5 -
 6
6 -
 7
7 -
 8
8 -
 9
9 -
 10
10 -
 11
11 -
 12
12 -
 13
13 -
 14
14 -
 15
15 -
 16
16 -
 17
17 -
 18
18 -
19
-
20
-
21
-
22
 |
 |

12
9
6
3
0
10.1%
2000
10.3%
2001
10.2%
2003
10.7%
2004
RANK: 3 RANK: 4 RANK: 3
7.9%
2002
RANK: 4
RANK: 1
Source: Thomson Financial
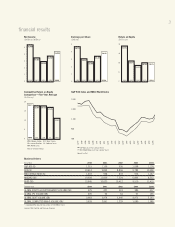
InstitutionalSecurities
(DollarsinMillions)
%
2003 2004 CHANGE
NETREVENUE $11,211 $13,063 17%
NON-INTERESTEXPENSES 7,566 8,966 19%
PROFITBEFORETAXES 3,645 4,097 12%
PROFITBEFORETAXESMARGIN 31% 31% N/A
InstitutionalSecurities
GlobalEquityandEquity-Related
UnderwritingMarketShare(%)and
Rank(#)
(CalendarYear)
GlobalCompletedM&A
MarketShare(%)andRank(#)
(CalendarYear)
GlobalDebtMarketShare(%)and
Rank(#)
(CalendarYear)
40
30
20
10
0
39.3%
2000
30.2%
2001
19.2%
2003
25.4%
2004
RANK: 2
RANK: 2
RANK: 3
28.3%
2002
RANK: 2
RANK: 2
Source: Thomson Financial
8
6
4
2
0
6.1%
2001
6.9%
2002
7.4%
2003
6.9%
2004
RANK: 7
7.8%
2000
RANK: 5
RANK: 5
RANK: 3
RANK: 2
Source: Thomson Financial
GlobalEquityandEquity-Related
U.S.public,Rule144a,domesticandinternationalequityandequity-relatedmarkets
(DollarsinBillions)
2004 MarketShare
Manager Amount 2004 2003
MorganStanley $54.3 10.7% 10.2%
GoldmanSachs 51.3 10.2 11.9
Citigroup 47.9 9.5 10.5
MerrillLynch 43.3 8.6 7.9
UBS 36.7 7.3 7.4
JPMorgan 30.6 6.1 8.2
DeutscheBank 26.6 5.3 5.7
CreditSuisseF.B. 24.4 4.8 5.6
LehmanBrothers 21.0 4.2 3.7
Nomura 16.2 3.2 3.1
TOP10TOTALS $352.3 69.9% 74.2%
INDUSTRYTOTAL $506.8 100.0% 100.0%
Source:ThomsonFinancial
GlobalDebt
U.S.public,Rule144a,domesticandinternationaldebtmarkets
(DollarsinBillions)
2004 MarketShare
Manager Amount 2004 2003
Citigroup $486.8 9.4% 10.2%
MorganStanley359.5 6.9 7.4
JPMorgan 355.8 6.9 7.4
LehmanBrothers 349.1 6.7 7.0
CreditSuisseF.B. 337.6 6.5 6.5
MerrillLynch 331.0 6.4 7.2
DeutscheBank 307.6 5.9 6.0
UBS 263.0 5.1 5.3
GoldmanSachs 234.9 4.5 5.1
BancofAmerica 195.0 3.8 3.9
TOP10TOTALS $3,220.3 62.1% 66.0%
INDUSTRYTOTALS $5,192.9 100.0% 100.0%
Source:ThomsonFinancial
InitialPublicOfferingsofStock
GlobalofferingsbyU.S.issuers,rankedby2004proceeds
(DollarsinBillions)
2004 2003
Market Market
Manager Proceeds Share Proceeds Rank Share
MorganStanley $7.3 16.3% $1.2 5 8.9%
GoldmanSachs 7.1 15.8 2.7 1 18.9
MerrillLynch 4.5 10.1 1.3 4 9.0
JPMorgan 4.0 8.8 0.2 16 1.1
Citigroup 3.6 8.1 2.1 2 14.7
CreditSuisseF.B. 3.6 8.0 1.1 6 7.8
FriedmanBillingsRamsey 3.1 7.0 1.6 3 11.7
LehmanBrothers 2.4 5.3 0.6 8 4.2
UBS 2.3 5.1 0.5 9 3.4
BancofAmerica 1.5 3.3 0.7 7 5.0
TOP10TOTALS $39.4 87.8% $12.0 84.7%
INDUSTRYTOTAL $44.8 100.0% $14.1 100.0%
Source:ThomsonFinancial
Top10GlobalStockIssues
(DollarsinBillions)
Issuer Date Amount
ENEL* Oct.22 $9.5
FranceTelecom* Sept.1 6.2
RoyalBankofScotland May5 4.8
Belgacom* March20 4.4
GE* March8 3.8
BayerischeHypo-Vereinsbank April6 3.7
DeutscheTelekom* Oct.11 3.7
ElectricPowerDevelopment Sept.27 3.4
Total Sept.29 3.2
GenworthFinancial* May24 2.9
Source:ThomsonFinancial *MorganStanleybookruntransaction
MorganStanleywasaleaderinmarket
shareandmanyofthetoptransactions.
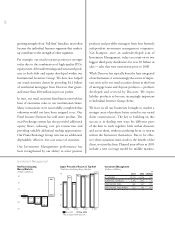
2004UnderwritingRankings
GlobalIPOMarketShare(%)and
Rank(#)
(CalendarYear)
15
10
5
0
14.5%
2001
5.1%
2002
4.9%
2003
10.3%
2004
RANK: 2
10.0%
2000
RANK: 2
RANK: 6 RANK: 5
RANK: 1
Source: Thomson Financial
12
9
6
3
0
10.2%
2000
11.6%
2001
11.0%
2002
10.4%
2003
10.3%
2004
RANK: 2
RANK: 1
RANK: 1
RANK: 1 RANK: 1
GlobalEquityTradingMarketShare1
(InPercent)
Source:McLagan
1 Totalequityexcludingnewissues
2 ThroughSept.2004
2
5
MorganStanleyAnnualReport2004