Morgan Stanley 2004 Annual Report Download - page 5
Download and view the complete annual report
Please find page 5 of the 2004 Morgan Stanley annual report below. You can navigate through the pages in the report by either clicking on the pages listed below, or by using the keyword search tool below to find specific information within the annual report.-
 1
1 -
 2
2 -
 3
3 -
 4
4 -
 5
5 -
 6
6 -
 7
7 -
 8
8 -
 9
9 -
 10
10 -
 11
11 -
 12
12 -
 13
13 -
 14
14 -
 15
15 -
 16
16 -
17
-
18
-
19
-
20
-
21
-
22
 |
 |

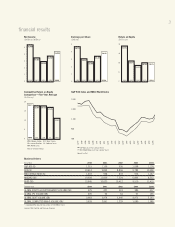
BusinessDrivers
FiscalYear 2000 2001 2002 2003 2004
S&P500($) 1,315 1,139 936 1,058 1,174
DOW($) 10,414 9,852 8,896 9,782 10,428
MSCIWORLDINDEX($) 1,203 998 833 976 1,127
NASDAQ($B) 19,928 11,609 7,524 6,866 8,532
NYSE($B) 10,945 10,623 10,412 9,510 11,410
CalendarYear 2000 2001 2002 2003 2004
GLOBALEQUITY&EQUITY-RELATED$VOLUME($B) 575 427 319 389 507
GLOBALIPOVOLUME($B) 205 92 64 57 136
GLOBALDEBTVOLUME($B) 2,983 3,974 3,940 4,973 5,193
GLOBALCOMPLETEDM&A$VOLUME($B)1 3,528 2,061 1,229 1,080 1,388
1 CompletedM&Adatafortransactionsof$100MMormore
Sources:FIBV,FactSetandThomsonFinancial
NetIncome
(DollarsinMillions)
ReturnonEquity
(InPercent)
EarningsperShare
(Diluted)
S&P500IndexandMSCIWorldIndex
5
4
3
2
1
0
$5,456
2000
$3,521
2001
$2,988
2002
$3,787
2003
$4,486
2004
5
4
3
2
1
0
$4.73
2000
$3.11
2001
$2.69
2002
$3.45
2003
$4.06
2004
32
24
16
8
0
30.9%
2000
18.0%
2001
14.1%
2002
16.5%
2003
16.8%
2004
CompetitiveReturnonEquity
Comparison—Five-YearAverage
(InPercent)
20
15
10
5
0
19.3%
MWD
18.0%
BSC
18.0%
LEH
17.2%
GS
11.3%
MER
MWD: Morgan Stanley
LEH: Lehman Brothers
MER: Merrill Lynch
BSC: Bear Stearns
GS: Goldman Sachs
Source: Company Filings
financialresults
3