Mitsubishi 2000 Annual Report Download - page 3
Download and view the complete annual report
Please find page 3 of the 2000 Mitsubishi annual report below. You can navigate through the pages in the report by either clicking on the pages listed below, or by using the keyword search tool below to find specific information within the annual report.-
 1
1 -
 2
2 -
 3
3 -
 4
4 -
 5
5 -
 6
6 -
 7
7 -
 8
8 -
 9
9 -
 10
10 -
 11
11 -
 12
12 -
 13
13 -
 14
14 -
15
-
16
-
17
-
18
-
19
-
20
-
21
-
22
-
23
-
24
-
25
-
26
-
27
-
28
-
29
-
30
-
31
-
32
-
33
-
34
-
35
-
36
-
37
-
38
-
39
-
40
-
41
-
42
-
43
-
44
-
45
-
46
-
47
-
48
-
49
-
50
-
51
-
52
-
53
-
54
-
55
-
56
-
57
-
58
-
59
-
60
-
61
-
62
-
63
-
64
-
65
-
66
-
67
-
68
 |
 |

Highlights
1
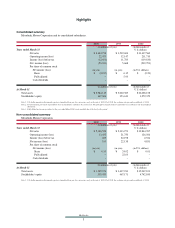
Consolidated summary
Mitsubishi Motors Corporation and its consolidated subsidiaries.
2000 1999 2000
(in millions of yen) (in thousands of
Years ended March 31
U.S. dollars)
Net sales ¥ 3,334,974 ¥ 3,512,606 $ 31,417,560
Operating income(loss) 22,473 32,147 211,710
Income (loss) before tax (12,651) 11,783 (119,180)
Net income (loss) (23,331) 5,668 (219,793)
Per share of common stock
Net income (loss):
(in yen) (in yen) (in U.S. dollars)
Basic ¥ (24.87) ¥ 6.15 $ (0.23)
Fully diluted – 5.93 –
Cash dividends – – –
(in millions of yen) (in thousands of
At March 31
U.S. dollars)
Total assets ¥ 2,784,119 ¥ 3,060,385 $ 26,228,158
Stockholders' equity 347,363 353,613 3,272,379
Non-consolidated summary
Mitsubishi Motors Corporation
2000 1999 2000
(in millions of yen) (in thousands of
Years ended March 31
U.S. dollars)
Net sales ¥ 2,106,522 ¥ 2,333,971 $ 19,844,767
Operating income (loss) 13,435 21,750 126,566
Income (loss) before tax 269 22,198 2,534
Net income (loss) 515 22,138 4,851
Per share of common stock
Net income (loss):
(in yen) (in yen) (in U.S. dollars)
Basic ¥ 0.55 ¥ 24.02 $ 0.01
Fully diluted – 22.03 –
Cash dividends – – –
(in millions of yen) (in thousands of
At March 31
U.S. dollars)
Total assets ¥ 1,599,373 ¥ 1,637,233 $ 15,067,103
Stockholders' equity 503,453 467,171 4,742,845
Highlights
Note 1 :U.S. dollar amounts in this annual report are translated from yen, for convenience only, at the rate of ¥106.15=U.S. $1, the exchange rate prevailing on March 31, 2000.
Note 1 :U.S. dollar amounts in this annual report are translated from yen, for convenience only, at the rate of ¥106.15=U.S. $1, the exchange rate prevailing on March 31, 2000.
Note 2: Certain amounts previously reported have been reclassified to conform to the current year. The principal reclassifications are detailed in 1 (o) of Notes to the Consolidated
Statements.
Note 3: Fully diluted net income per share for the year ended March 2000 is not available due to the loss for the period.