Mercury Insurance 2010 Annual Report Download - page 6
Download and view the complete annual report
Please find page 6 of the 2010 Mercury Insurance annual report below. You can navigate through the pages in the report by either clicking on the pages listed below, or by using the keyword search tool below to find specific information within the annual report.-
 1
1 -
 2
2 -
 3
3 -
 4
4 -
 5
5 -
 6
6 -
 7
7 -
 8
8 -
 9
9 -
 10
10 -
 11
11 -
 12
12 -
 13
13 -
 14
14 -
 15
15 -
 16
16 -
 17
17 -
18
-
19
-
20
-
21
-
22
-
23
-
24
-
25
-
26
-
27
-
28
-
29
-
30
-
31
-
32
-
33
-
34
-
35
-
36
-
37
-
38
-
39
-
40
-
41
-
42
-
43
-
44
-
45
-
46
-
47
-
48
-
49
-
50
-
51
-
52
-
53
-
54
-
55
-
56
-
57
-
58
-
59
-
60
-
61
-
62
-
63
-
64
-
65
-
66
-
67
-
68
-
69
-
70
-
71
-
72
-
73
-
74
-
75
-
76
-
77
-
78
-
79
-
80
-
81
-
82
-
83
-
84
-
85
-
86
-
87
-
88
-
89
-
90
-
91
-
92
-
93
-
94
-
95
-
96
-
97
-
98
-
99
-
100
-
101
-
102
-
103
-
104
-
105
-
106
-
107
-
108
-
109
-
110
-
111
-
112
-
113
-
114
-
115
-
116
-
117
-
118
-
119
-
120
-
121
-
122
-
123
-
124
-
125
-
126
 |
 |

4MERCURY GENERAL CORPORATION
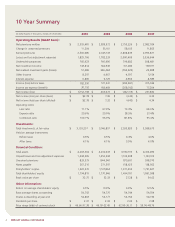
10 Year Summary
All dollar figures in thousands, except per share data 2010 2009 2008 2007
Operating Results (GAAP Basis):
Net premiums written $ 2,555,481 $ 2,589,972 $ 2,750,226 $ 2,982,024
Change in unearned premiums 11,204 35,161 58,613 11,853
Earned premiums 2,566,685 2,625,133 2,808,839 2,993,877
Losses and loss adjustment expenses 1,825,766 1,782,233 2,060,409 2,036,644
Underwriting expenses 760,923 760,990 799,682 818,481
Net investment income 143,814 144,949 151,280 158,911
Net realized investment gains (losses) 57,089 346,444 (550,520) 20,808
Other income 8,297 4,967 4,597 5,154
Interest expense 6,806 6,729 4,966 8,589
Income (loss) before taxes 182,390 571,541 (450,861) 315,036
Income tax expense (benefit) 30,192 168,469 (208,742) 77,204
Net income (loss) $ $152,198 $ 403,072 $ (242,119) $ 237,832
Net income (loss) per share (basic) $ $2.78 $ 7.36 $ (4.42) $ 4.35
Net income (loss) per share (diluted) $ $2.78 $ 7.32 $ (4.42) $ 4.34
Operating ratios
Loss ratio 71.1% 67.9% 73.3% 68.0%
Expense ratio 29.6% 29.0% 28.5% 27.4%
Combined ratio 100.7% 96.9% 101.8% 95.4%
Investments:
Total investments, at fair value $ 3,155,257 $ 3,146,857 $ 2,933,820 $ 3,588,675
Yield on average investments
Before taxes 4.6% 4.5% 4.4% 4.6%
After taxes 4.1% 4.1% 3.9% 4.0%
Financial Condition:
Total assets $ 4,203,364 $ 4,232,633 $ 3,950,195 $ 4,414,496
Unpaid losses and loss adjustment expenses 1,034,205 1,053,334 1,133,508 1,103,915
Unearned premiums 833,379 844,540 879,651 938,370
Notes payable 267,210 271,397 158,625 138,562
Policyholders’ surplus 1,322,270 1,517,864 1,371,095 1,721,827
Total shareholders’ equity 1,794,815 1,770,946 1,494,051 1,861,998
Book value per share $ 32.75 $ 32.33 $ 27.28 $ 34.02
Other Information:
Return on average shareholders’ equity 6.5% 10.9% 6.9% 12.5%
Basic average shares outstanding 54,792 54,770 54,744 54,704
Shares outstanding at year-end 54,803 54,777 54,764 54,730
Dividends per share $ 2.37 $ 2.33 $ 2.32 $ 2.08
Price range (bids) of common stock $ 46.66-37.38 $ 46.09-22.45 $ 62.00-36.11 $ 59.06-48.76